.svg)
Knowledge Graphs in Biomedical Research: Data-Centric AI with Polly KG

April 8, 2026
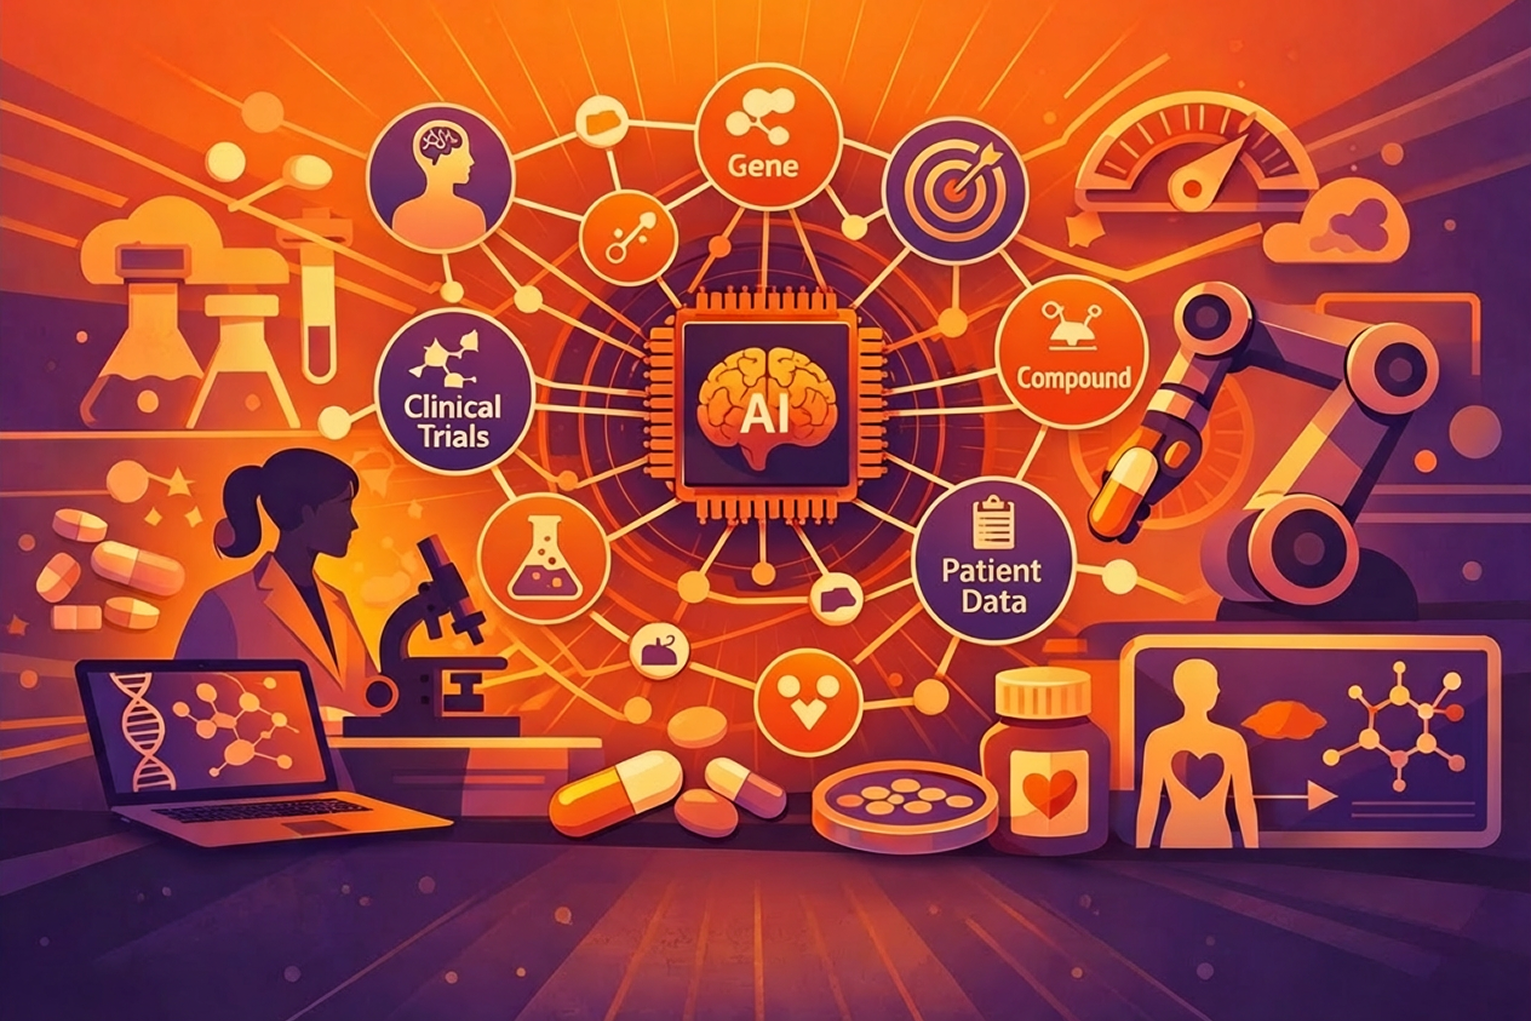
In the rapidly advancing field of life sciences, the ability to synthesize vast amounts of information is no longer just an advantage, it is a necessity. For years, Knowledge Graphs (KGs) have served as the backbone for connecting disparate pieces of biological information. However, as our understanding of disease grows more complex, the methods we use to map that knowledge must also evolve.
A large number of knowledge graphs in life sciences are built primarily from scientific literature such as PubMed abstracts or full articles. These systems extract relationships based on co-occurrence, how often genes, diseases, or drugs appear together in papers. While useful, this approach comes with trade-offs as literature tends to be:
As a result, many literature-based graphs capture relationships that are directionally unclear or lack the context needed for more complex biological questions. This doesn’t make them ineffective but it does highlight the need for approaches that can go deeper, especially as datasets continue to grow in scale and complexity.
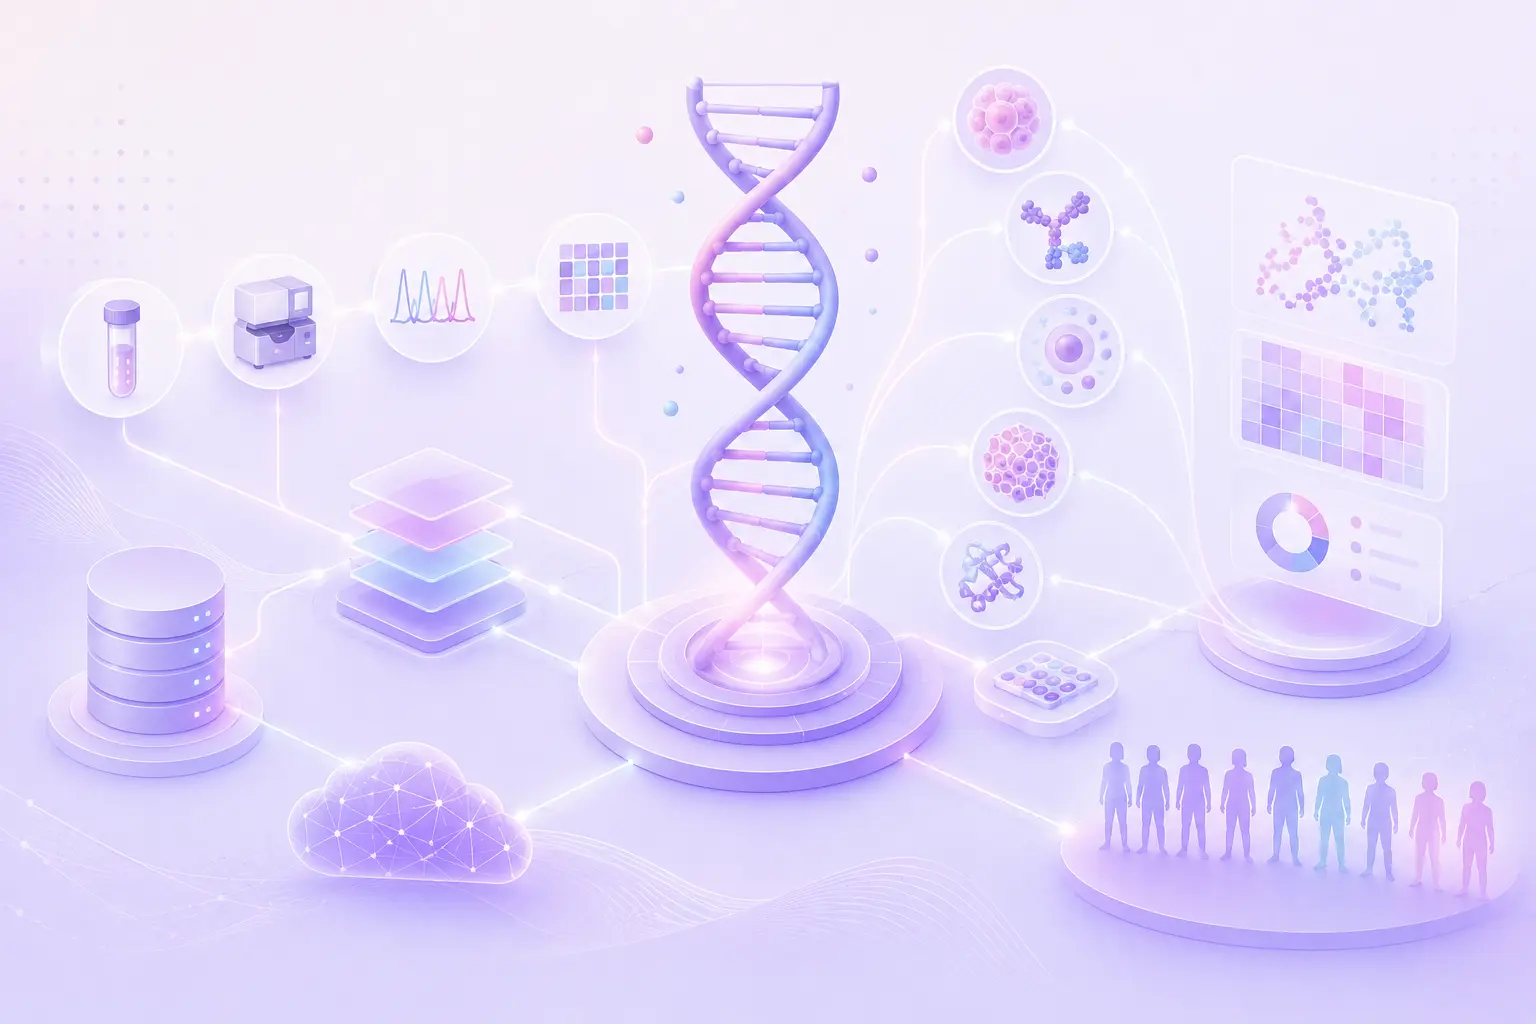
More recently, there’s been a shift toward building knowledge graphs that are grounded in curated, multi-modal datasets.
In this model, data from genomics, transcriptomics, proteomics, clinical studies, and molecular interactions forms the foundation. Literature is still used but more as a layer of supporting evidence rather than the primary source.
This change brings a few important advantages:
Polly KG follows this data-centric approach. It integrates curated public datasets, multi-omics profiles(genomics, transcriptomics, proteomics), clinical and phenotypic data, molecular interactions,
and literature evidence into a unified, evidence-backed knowledge graph. Every relationship in
Polly KG is traceable, biologically grounded, and designed for hypothesis-driven exploration,
enabling a deeper understanding of complex biological systems.
One of the more practical differences with Polly KG is how it’s implemented.
Polly KG is not a one-size-fits-all fixed platform focused on broad data aggregation or literature-based associations. Instead, it is delivered as a Platform-as-a-Service (PaaS), a model intentionally developed and designed to evolve with each customer’s data ecosystem, scientific priorities, and analytical goals. This co- building approach approach prioritizes customization, scalability, and iterative improvement, ensuring that each deployment reflects the specific biological and research context of the organization.
There are two main layers involved:
If you need an instant solution, traditional SaaS tools (e.g., Causaly, Qiagen Digital Insights) may be suitable. However, if the goal is to capture your unique biological context in a purpose-built knowledge graph, Polly KG’s data-centric approach delivers a more practical and flexible solution for everyday research across diverse data types and therapeutic areas.
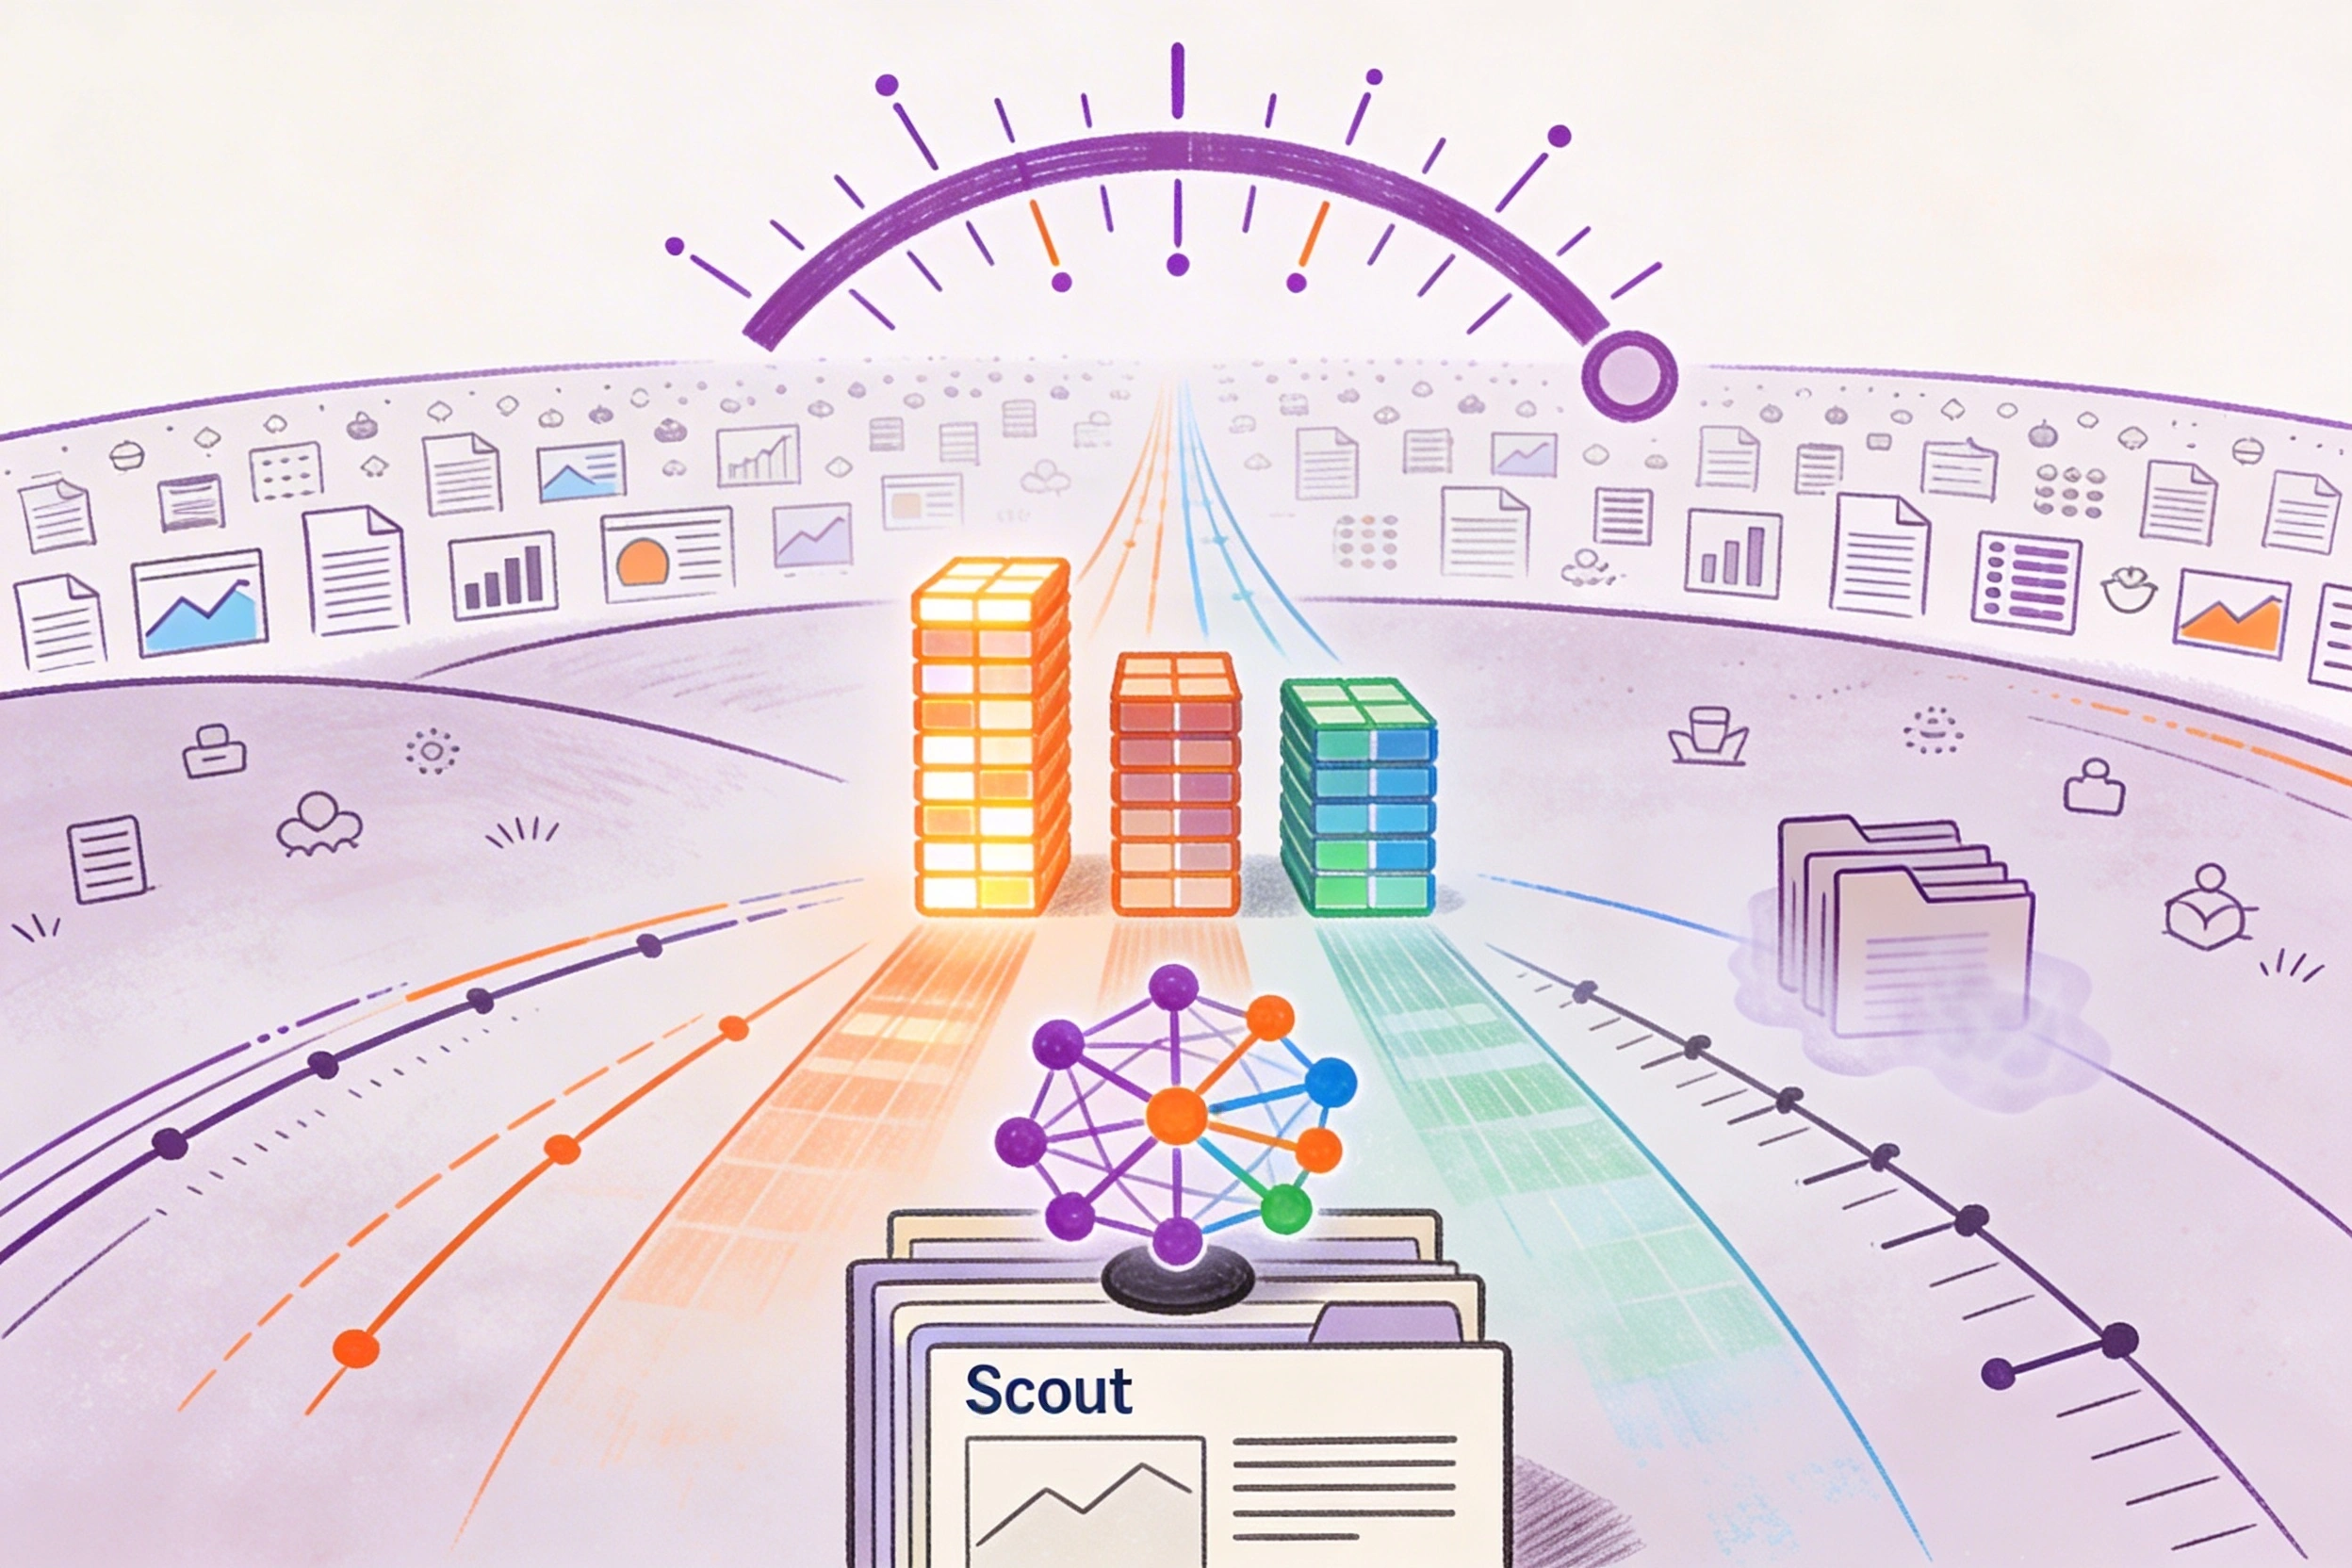
Modern biomedical questions rarely rely on a single type of data. Understanding disease mechanisms often requires combining different types of data like Genomic and transcriptomic data, Proteomic and metabolomic profiles, Clinical and phenotypic information, Literature-derived insights.
Polly KG supports integration across 30+ data modalities (View Full List of Supported Modalities and Source). This creates a more cohesive view of biological systems, making it easier to explore relationships that span different data types.
A biotech company exploring cross-species disease biology was working with fragmented datasets across multiple modalities. Integrating and analyzing this data in a meaningful way was proving time-intensive.
Using PollyKG, they were able to bring together curated datasets, align them across species, and apply scoring frameworks tailored to their research goals.
Over a period of six months, this approach began to show tangible outcomes. The team was able to:
Read the full case study here.
If you’re interested in how knowledge graphs are applied in real-world research:
To see how this approach could fit into your workflows, it may be worth seeing how a data-centric knowledge graph can be tailored to your research needs. Connect with us to build your own Polly Knowledge Graph.

.svg)
.svg)


%201%20(1).svg)


.svg)
%20(1).svg)


