.svg)
%201.svg)
How Quality Control Makes a Knowledge Graph Trustworthy
%20(1).svg)

July 30, 2026
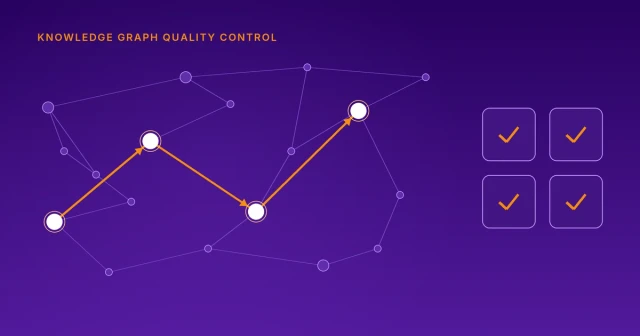
Every pharma & biotech organization today has a knowledge graph (KG). However, the ultimate usability is the important question here. Most teams that we talk to have some sort of trust issues with their KG. A common complaint is that the knowledge graphs have massive data corpus, but do not allow teams to go deeper because their KG can’t process complex queries.
In this blog, we present our 4-step process of performing quality control on Elucidata’s knowledge graphs. The end goal of this is to ensure that scientists can ask complex biological questions, and get the answers they can trust and base their decisions upon.
We’ll be using Acute Myeloid Leukemia as a disease example because it is easier to judge a knowledge graph against a real question like:
Within AML-relevant pathways such as JAK-STAT signaling, TNF-alpha-driven NF-κB activation, or epigenetic regulation:
A knowledge graph is a network of biological relationships that connect entities such as genes, diseases, and drugs. The underlying data is the same as in a spreadsheet, but structured for interactive, visual traversal instead of static rows and columns.
The building blocks that carry the whole model are:

Three questions that we keep in mind when designing knowledge graphs are:
A personalized, well-versioned graph still has to prove that it works, and that proof of concept is quality control. Every release runs through four checks before a research team relies on it. Skip one, and a well-formed query can still return an answer that should not be trusted.
Here we have the four pillars of quality check before every deployment of our Knowledge Graph, PollyKG:

Structural QC confirms the architecture. Before a query can travel from a disease to a gene to a drug, that path has to actually exist in the graph while connecting the right kinds of nodes in the right direction. Structural QC checks node and edge counts against the data model, confirms every edge lands where it should. It flags nodes with no connections at all, and catches duplicate edges that need an explanation.
For e.g: Two datasets both reporting an association between FLT3 and AML for different reasons.
Properties QC catches the silent failures. A biomedical knowledge graph can carry hundreds of properties across its nodes and edges, but the danger is the same kind of information stored in two different ways than a missing one.
For e.g: A chromosome location as a number in one place and text in another.
Properties QC confirms every property carries the correct data type and means the same thing everywhere it appears, so a query actually returns everything it should, not just some of it.
Scores QC protects prioritization. Knowledge graphs built for target discovery often carry custom, program-specific scores designed to help a team prioritize which targets to pursue. These scores are typically built around a program's own criteria and are not part of a shared base graph.
Scores QC confirms that scores fall within their expected ranges, checks whether distributions look reasonable rather than skewed by an unnoticed error, and compares scores from one release to the next.
Scientific QC validates multi-hop query outputs against established benchmark biology before deployment, ensuring curation errors surface internally rather than expending your wet-lab validation budget.
For instance, when validating cell-type specificity, this layer automatically flags false positives generated by bulk RNA-seq signals that mask rare leukemic blast subpopulation profiles by cross-referencing findings against baseline single-cell atlases.
Ask a single-hop question and you traverse one relationship like which small-molecule inhibitors target FLT3?
It’ll return with Midostaurin, gilteritinib, or quizartinib, all three approved for FLT3-mutated AML. One relationship, one answer, easy to verify by eye.
Real target discovery questions do not look like that. They look like which genes participate in a pathway already disrupted in this disease, and which of those still have no mutation-selective agent against them?
That question traverses disease to gene, gene to pathway, pathway back out to other member genes. Three hops and this is where the interesting biology lives, because the answer is not something you would reach by reading a single association.

Run it against AML epigenetic regulation and the graph returns IDH2 and DNMT3A as co-members of the same disrupted machinery. IDH2 has enasidenib, a mutation-selective inhibitor approved for IDH2-mutant relapsed or refractory disease. DNMT3A, mutated in roughly a quarter of AML cases, has no equivalent mutation-selective agent. Hypomethylating agents act on DNA methyltransferases broadly, but nothing targets mutant DNMT3A the way enasidenib targets mutant IDH2.
That gap is a program hypothesis but it came out of pathway-level traversal, not a literature search.
Every knowledge graph starts from the same base. What determines whether it answers your question is what gets added next as an update.
For an AML program, that means single-cell resolution where bulk data would mislead, leukemic blast subtypes represented as distinct entities rather than collapsed into one, and scoring logic built around your prioritization criteria instead of someone else's. A solid tumor program needs a different set of extensions entirely. One graph built the same way for every indication serves none of them well.
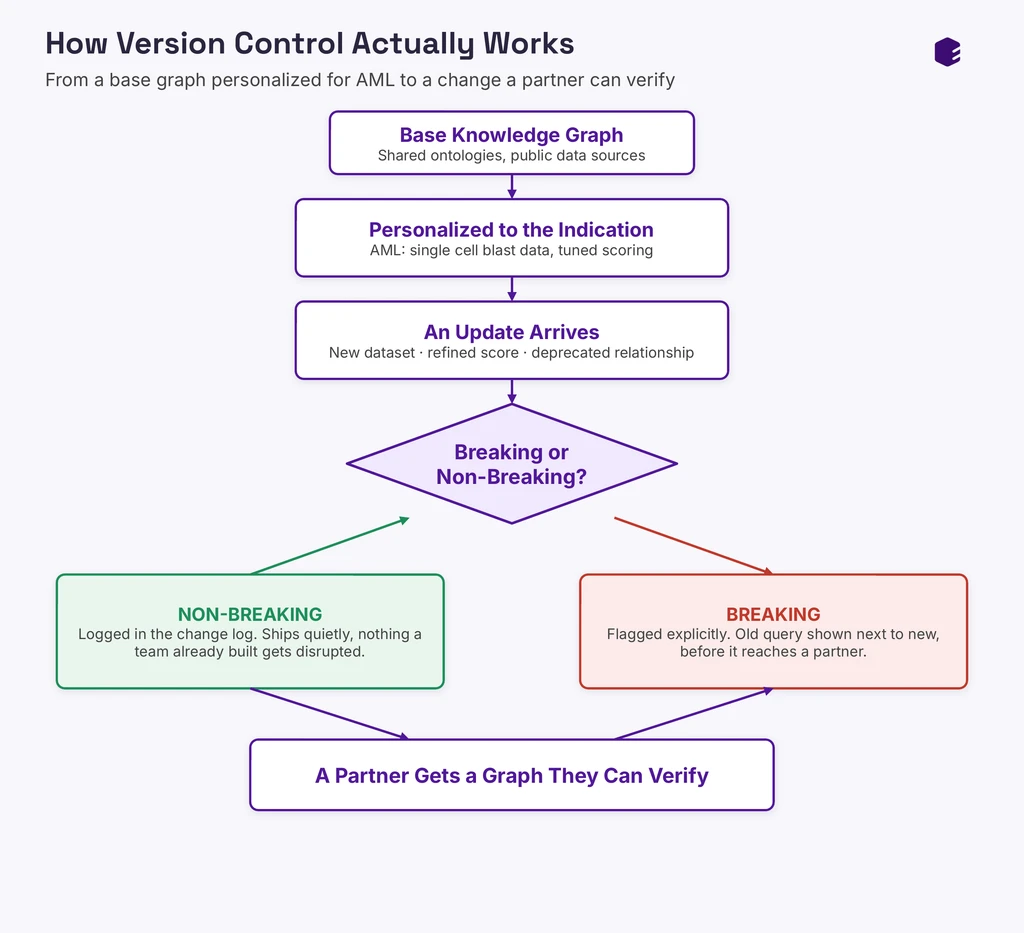
Version control is the practice of tracking exactly what changed in a knowledge graph, when and why. It matters so that a result can be trusted after a change as much as before it.
Every update, at the node, edge, or schema level, is classified as breaking or non-breaking the moment it lands. Breaking changes arrive with the old query shown next to the new one, before they reach you. Cadence follows what your team can absorb, not a release calendar.
A knowledge graph that surfaces DNMT3A as an untapped target in an AML epigenetic program is only valuable if the three hops that got you there were each verified. Otherwise, it is a hypothesis built on an average signal, and you will not find out until the validation data comes back.
That verification based on an evidence-backed signal is the product we offer. Polly Knowledge Graph is Elucidata's KG platform for target identification that is personalized to your indication, versioned transparently, and checked across structure, properties, scores, and biology before you start querying on it. Book a demo with us to have an exploratory and interactive session on our KG.
Also, have a look into our on-demand webinar based on evidence-driven target discovery in AML using Elucidata’s MCP servers.
Your graph will always return an answer. However, the real question worth asking is how much can you trust and rely on that answer!


.svg)
.svg)


%201%20(1).svg)


%201%20(1).svg)





%20(1).svg)


.svg)
%20(1).svg)


