.svg)
%201.svg)
From Multimodal Data to Biological Insight: Why Integration Matters in Biological Research
%20(1).svg)

September 29, 2026
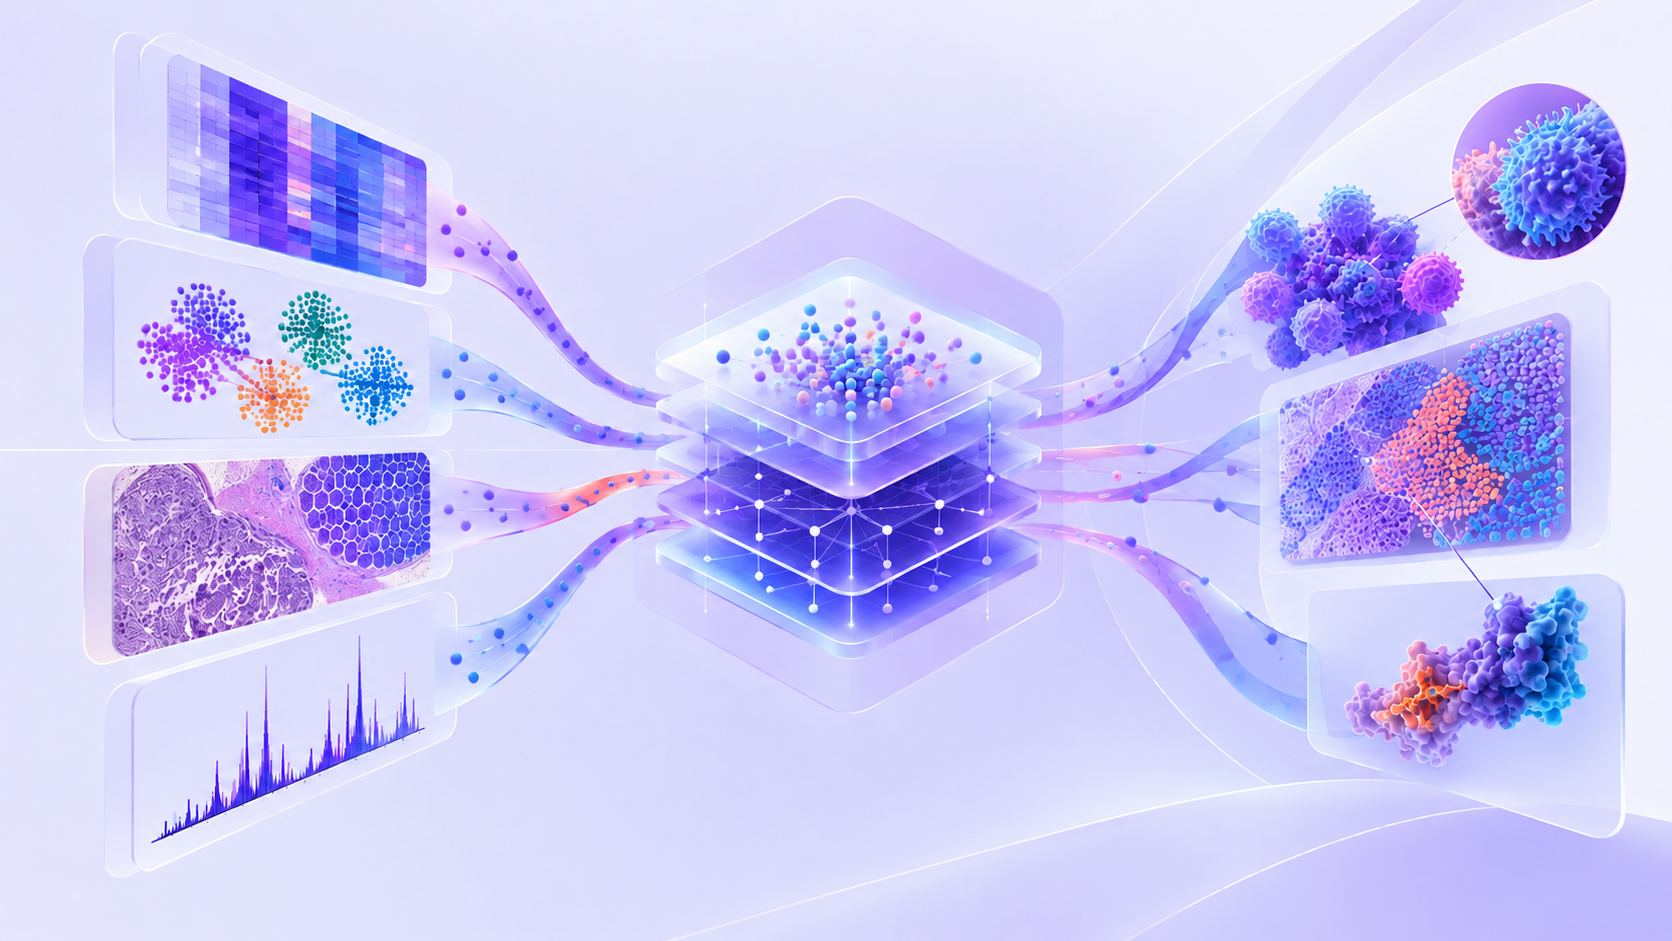
Why does one patient respond to a checkpoint inhibitor while another progresses within months? There is rarely a single answer. The difference can show up in gene expression, in which cells populate the tumor, in how those cells are arranged in tissue, and in which proteins are active. Bulk RNA-seq, single-cell RNA-seq, spatial transcriptomics and proteomics each capture one of these views. The insight usually sits in the connections between them, and making those connections depends as much on how the data is organized as on the methods used to analyze it.
Consider a translational team working on a melanoma cohort treated with anti-PD-1 therapy. Some patients respond durably, while others progress quickly. The team has pretreatment biopsies profiled four ways: bulk RNA-seq, single-cell RNA-seq, spatial transcriptomics and mass spectrometry proteomics.
The data comes from one trial, yet it arrives as four datasets. Samples carry different identifiers, annotations follow different conventions, and each assay was processed by its own pipeline.
Each modality also has its own blind spot. Bulk RNA-seq averages expression across thousands of cells, so a signal cannot easily be assigned to a cell type. Single-cell RNA-seq resolves individual cells, but dissociation removes their positions and can under-represent fragile populations. Spatial transcriptomics keeps tissue position, with resolution that depends on the platform. Proteomics measures the molecules that carry out function, though low-abundance proteins often go undetected.
Suppose non-responders show a stronger inflammatory signature in bulk data. That tells the team that something differs, but not what drives it. Deconvolution tools such as CIBERSORTx use a single-cell reference to estimate cell-type proportions [1]. They may trace the signal to an expanded myeloid compartment, possibly immunosuppressive macrophages, which is a different mechanism from generic inflammation and points toward different targets. The estimate holds only when the reference matches the tissue and disease state. A reference built from primary skin lesions can mislead when half the biopsies come from lymph node metastases.
The single-cell data can then show which populations differ between groups, such as exhausted CD8+ T cells or specific macrophage states in non-responders [2]. What it cannot show is where those cells sat, and two tumors with similar cell composition can organize it very differently.
Spatial mapping tools such as cell2location and RCTD place single-cell types onto tissue sections [3, 4]. This separates inflamed tumors, where CD8+ T cells infiltrate the tumor bed, from immune-excluded tumors, where they gather at the margin. Exclusion has been associated with poorer response to PD-1 blockade, and dissociated data cannot detect it [5]. Ligand-receptor methods such as CellPhoneDB and NicheNet can suggest which signals pass between neighboring cells, although proximity alone does not establish that an interaction occurs.
Proteomics then tests whether a candidate holds up at the functional layer. RNA and protein levels often diverge because of translation, protein turnover and secretion [6]. A target supported at both levels therefore carries stronger evidence, and a mismatch is a reason to look closer. Where RNA and surface protein are measured in the same cells, as in CITE-seq, models such as totalVI analyze both layers jointly [7].
Stratification draws these threads together. Interferon-gamma related expression signatures have been associated with response to PD-1 blockade [8]. Yet a subgroup defined from bulk expression alone may reflect biopsy site, tumor purity or processing batch. Spatial and protein evidence can show whether it reflects a mechanism the team can defend. Bulk data shows what changed, single-cell data shows which cells are involved, spatial data shows where they are, and proteomics shows whether the signal reaches the protein level. Taken together, they let a team move from a correlation toward a testable biological explanation.
None of this works if the four datasets simply sit side by side. The architecture underneath needs four capabilities, each built on the one before it. Together they are how the FAIR principles (findable, accessible, interoperable, reusable) are put into practice for multimodal data [9].
The first is a standardized schema. Every dataset arrives in a common representation, with raw counts kept separate from normalized values. Metadata is mapped to shared ontologies such as UBERON for anatomy, the Cell Ontology for cell types and MONDO for disease. Identifier mismatches are resolved once, at ingestion, instead of by every analyst. This is unglamorous work, and it is where most integration efforts fail, because no downstream model can reconcile what the schema never aligned.
The second is a shared representation. Bulk and single-cell profiles are different kinds of objects, so they are projected into a common space where technical batch is modeled explicitly, as variational autoencoders in the scVI family do for expression data [10]. The risk is confounding. If every responder biopsy in the melanoma cohort was processed at one site, batch correction could remove the response signal along with the site effect [11]. Study design metadata therefore has to stay attached to the data from the start.
The third is consistent labeling. Cell types should be assigned by projecting new data onto an annotated reference atlas, with a confidence score for each label, instead of by fresh clustering from each analyst. The gain is partly speed and mostly reproducibility.
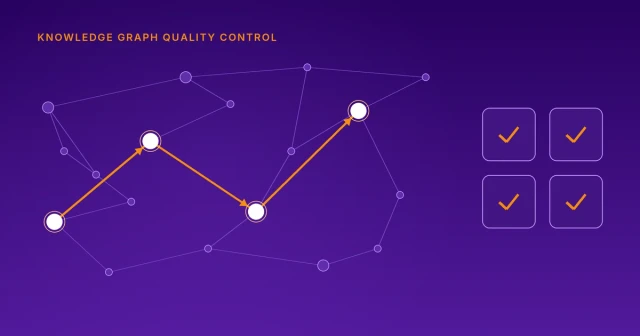
The fourth is queryable relationships. Take a question such as which genes are expressed in exhausted CD8+ T cells near a myeloid population and confirmed at the protein level. Across separate files, that takes a series of manual joins. When relationships are stored as a graph, it takes a single traversal.
Running through all four is provenance: persistent identifiers, controlled access and a record of how each dataset was processed. For the melanoma team, provenance means a spatial finding next year can be traced to the same patients, pipeline version and annotation reference as this year's bulk result. A subgroup that later shapes trial eligibility can be traced to the exact data and analyses behind it.
At Elucidata, these principles shape the architecture of Polly, which standardizes, processes, organizes and connects multimodal datasets within one environment.
Workspaces form the management layer, handling data uploads, collaboration, permissions and versioning. Pipelines form the analysis layer, running containerized, configurable workflows for applications such as bulk RNA-seq and single-cell multi-omics. Polly Atlas forms the data layer, holding harmonized, versioned multimodal datasets that can be explored and queried together.
Harmonization happens at ingestion. Polly processes more than 30 data modalities into a common representation and maps metadata to controlled vocabularies, so datasets generated independently become searchable and comparable. Metadata is structured and validated before analysis begins, which spares downstream models and researchers from resolving the same inconsistencies repeatedly. Automated quality checks flag metadata conflicts, batch effects and technical artifacts before they reach downstream analysis.
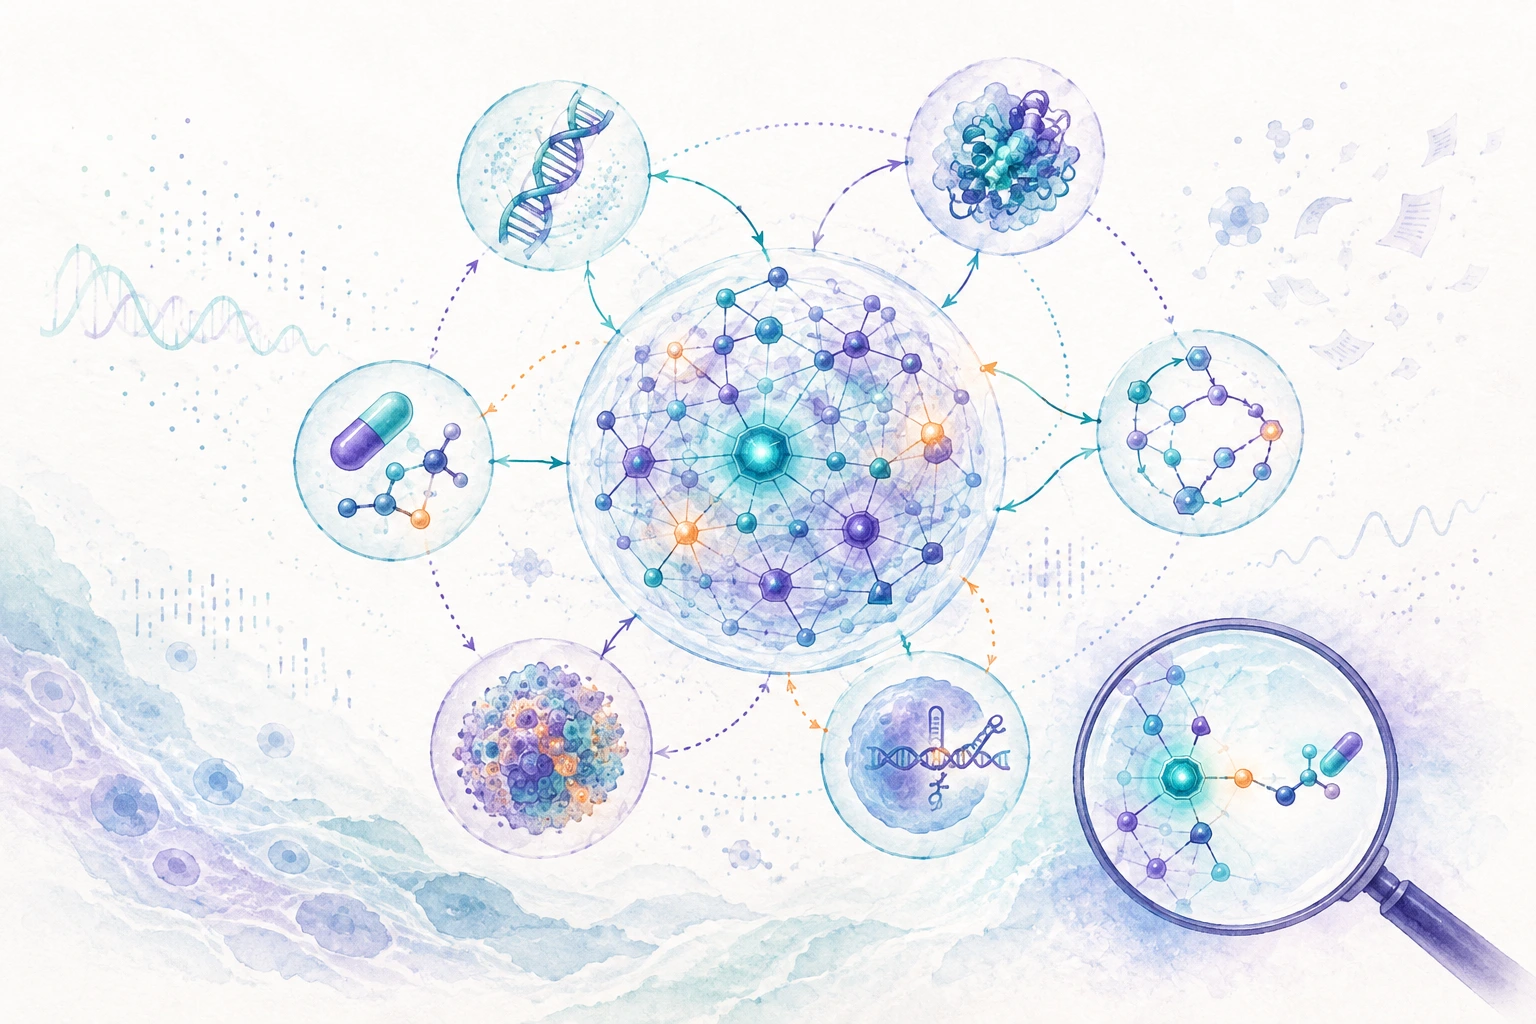
Polly KG then connects genes, proteins, diseases, cell types, drugs and pathways through defined, evidence-backed relationships, combining public sources such as Open Targets with proprietary data. It gives researchers a way to move between layers of biological evidence while each dataset keeps its own context.
Multi-omics research will soon involve more capable agents, richer spatial and proteomic measurements and larger multimodal foundation models. Each depends on data that is standardized, traceable and connected. An agent working from mismatched identifiers can return a confident answer built on the wrong samples, and a foundation model trained on unharmonized data can learn batch structure alongside biology. As models become more sophisticated, the quality of the data beneath them matters more. A well-built multimodal architecture gives a research organization a connected evidence base, where a finding can be traced to its source, tested against other data types and reused across programs.


.svg)
.svg)


%201%20(1).svg)


%201%20(1).svg)


%20(1).svg)




.svg)
%20(1).svg)


