.svg)
%201.svg)
5 Key Capabilities to Look for in a Biomedical Knowledge Graph
%20(1).svg)
Rijul Kushwaha

September 28, 2026
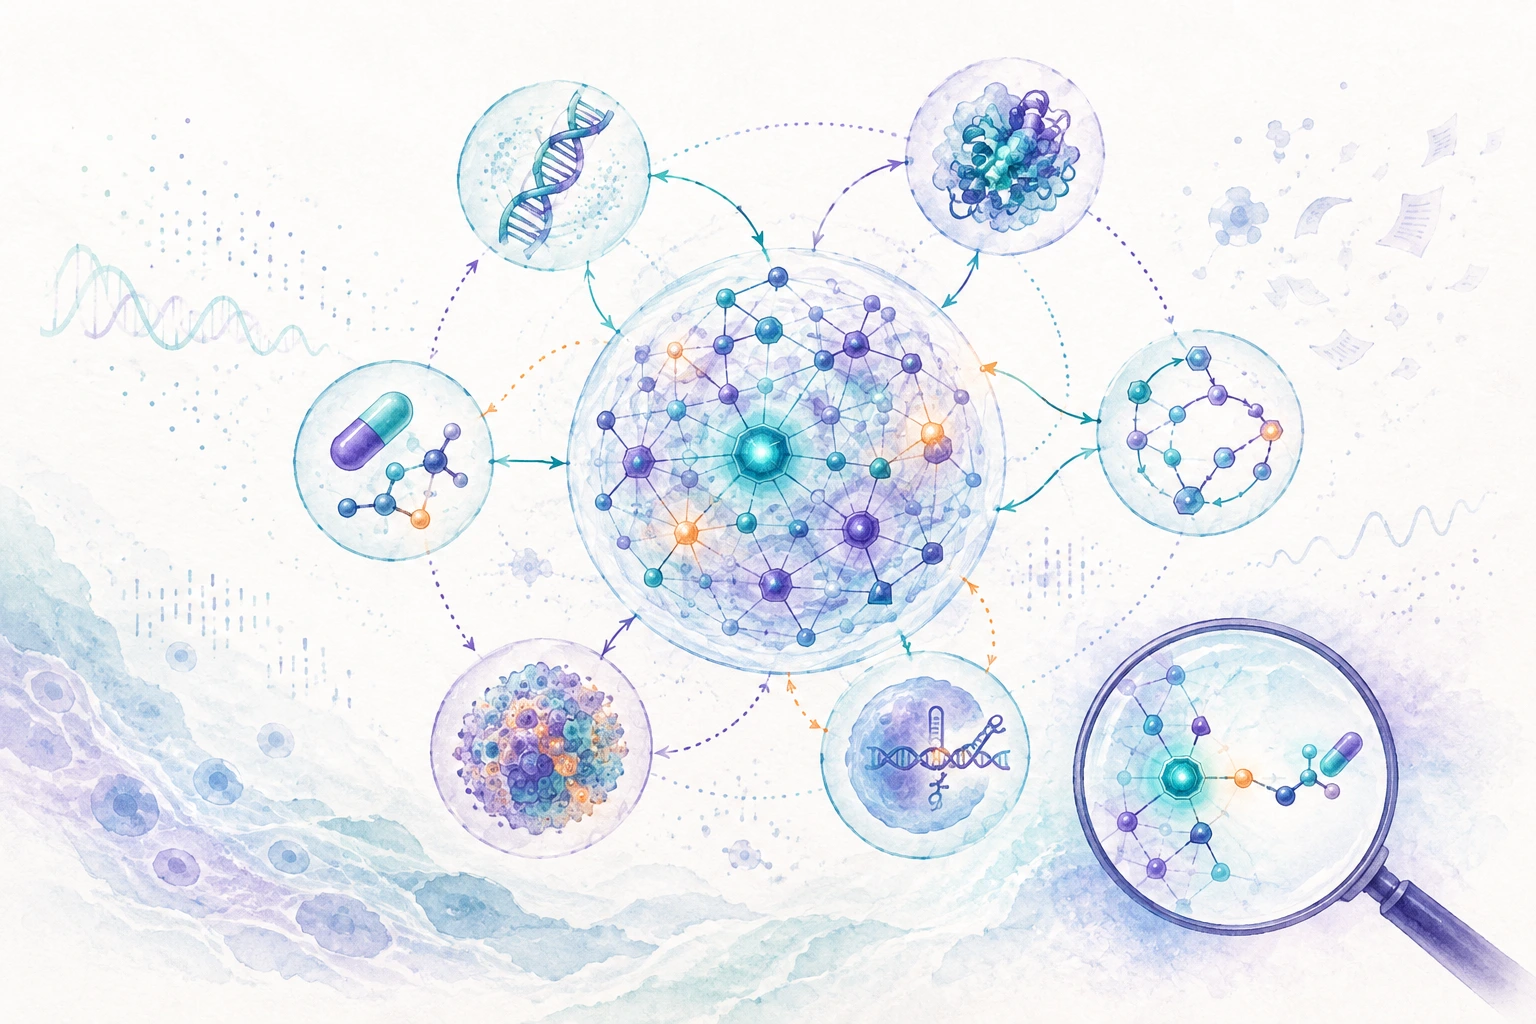
Biomedical knowledge graphs are increasingly used in drug discovery to reconstruct disease mechanisms, connect evidence across data modalities, surface novel targets, identify pathway crosstalk, and find repurposing opportunities.
The reason they work is that biology is connected. A gene encodes a protein, the protein participates in a pathway, and the pathway contributes to a disease mechanism. A knowledge graph is the relational layer that represents these connections and lets them be traversed, linking genes, proteins, pathways, diseases, and drugs through typed relationships such as encodes, regulates, activates, and inhibits.
The underlying data supplies the evidence for each of those relationships. Genetic studies, expression datasets, CRISPR screens, pathway resources, experimental results, and the literature determine which connections belong in the graph and the biological context in which they hold. Brought together in one model, they let a scientist follow the evidence from a disease signal to a mechanism, and from a mechanism to a target worth pursuing.
This is also why all knowledge graphs are not equally useful. Two graphs can contain the same genes, proteins, drugs, and diseases and still support very different scientific questions. The difference lies in what is encoded between the nodes, how strong the evidence behind each connection is, and how far the biology can be followed.
Here are five capabilities worth looking for.
Evidence for a candidate target is spread across three data modalities, each with its own formats and sources. Most knowledge graphs are built predominantly on literature, and represent the others sparsely. An integrated graph holds all three in a single schema, so you can query can combine a genetic dependency, a published mechanism, and a morphological phenotype for the same gene.
Three further requirements separate integration from aggregation. Literature should be read in full text, since Methods, Results, and supplementary sections carry the experimental detail that abstracts omit. Every entity should resolve to a shared ontology, so a gene named differently across ten sources becomes one node. And every source should be versioned, because unmonitored drift in upstream data is one of the principal failure modes of biomedical knowledge graphs [11].
How Elucidata's Polly KG does this - Polly KG integrates 19 tabular data types across 1,000+ disease and normal cohorts, 8M+ full-text papers and 60M sentences, and 10+ imaging modalities covering 50M+ files, alongside Open Targets, Reactome, and pathway, interaction, and drug databases. Entities are harmonized to standard ontologies, and proprietary data enters the same schema. Polly Scout searches more than a million public records first, so a program starts from the datasets that fit its question.
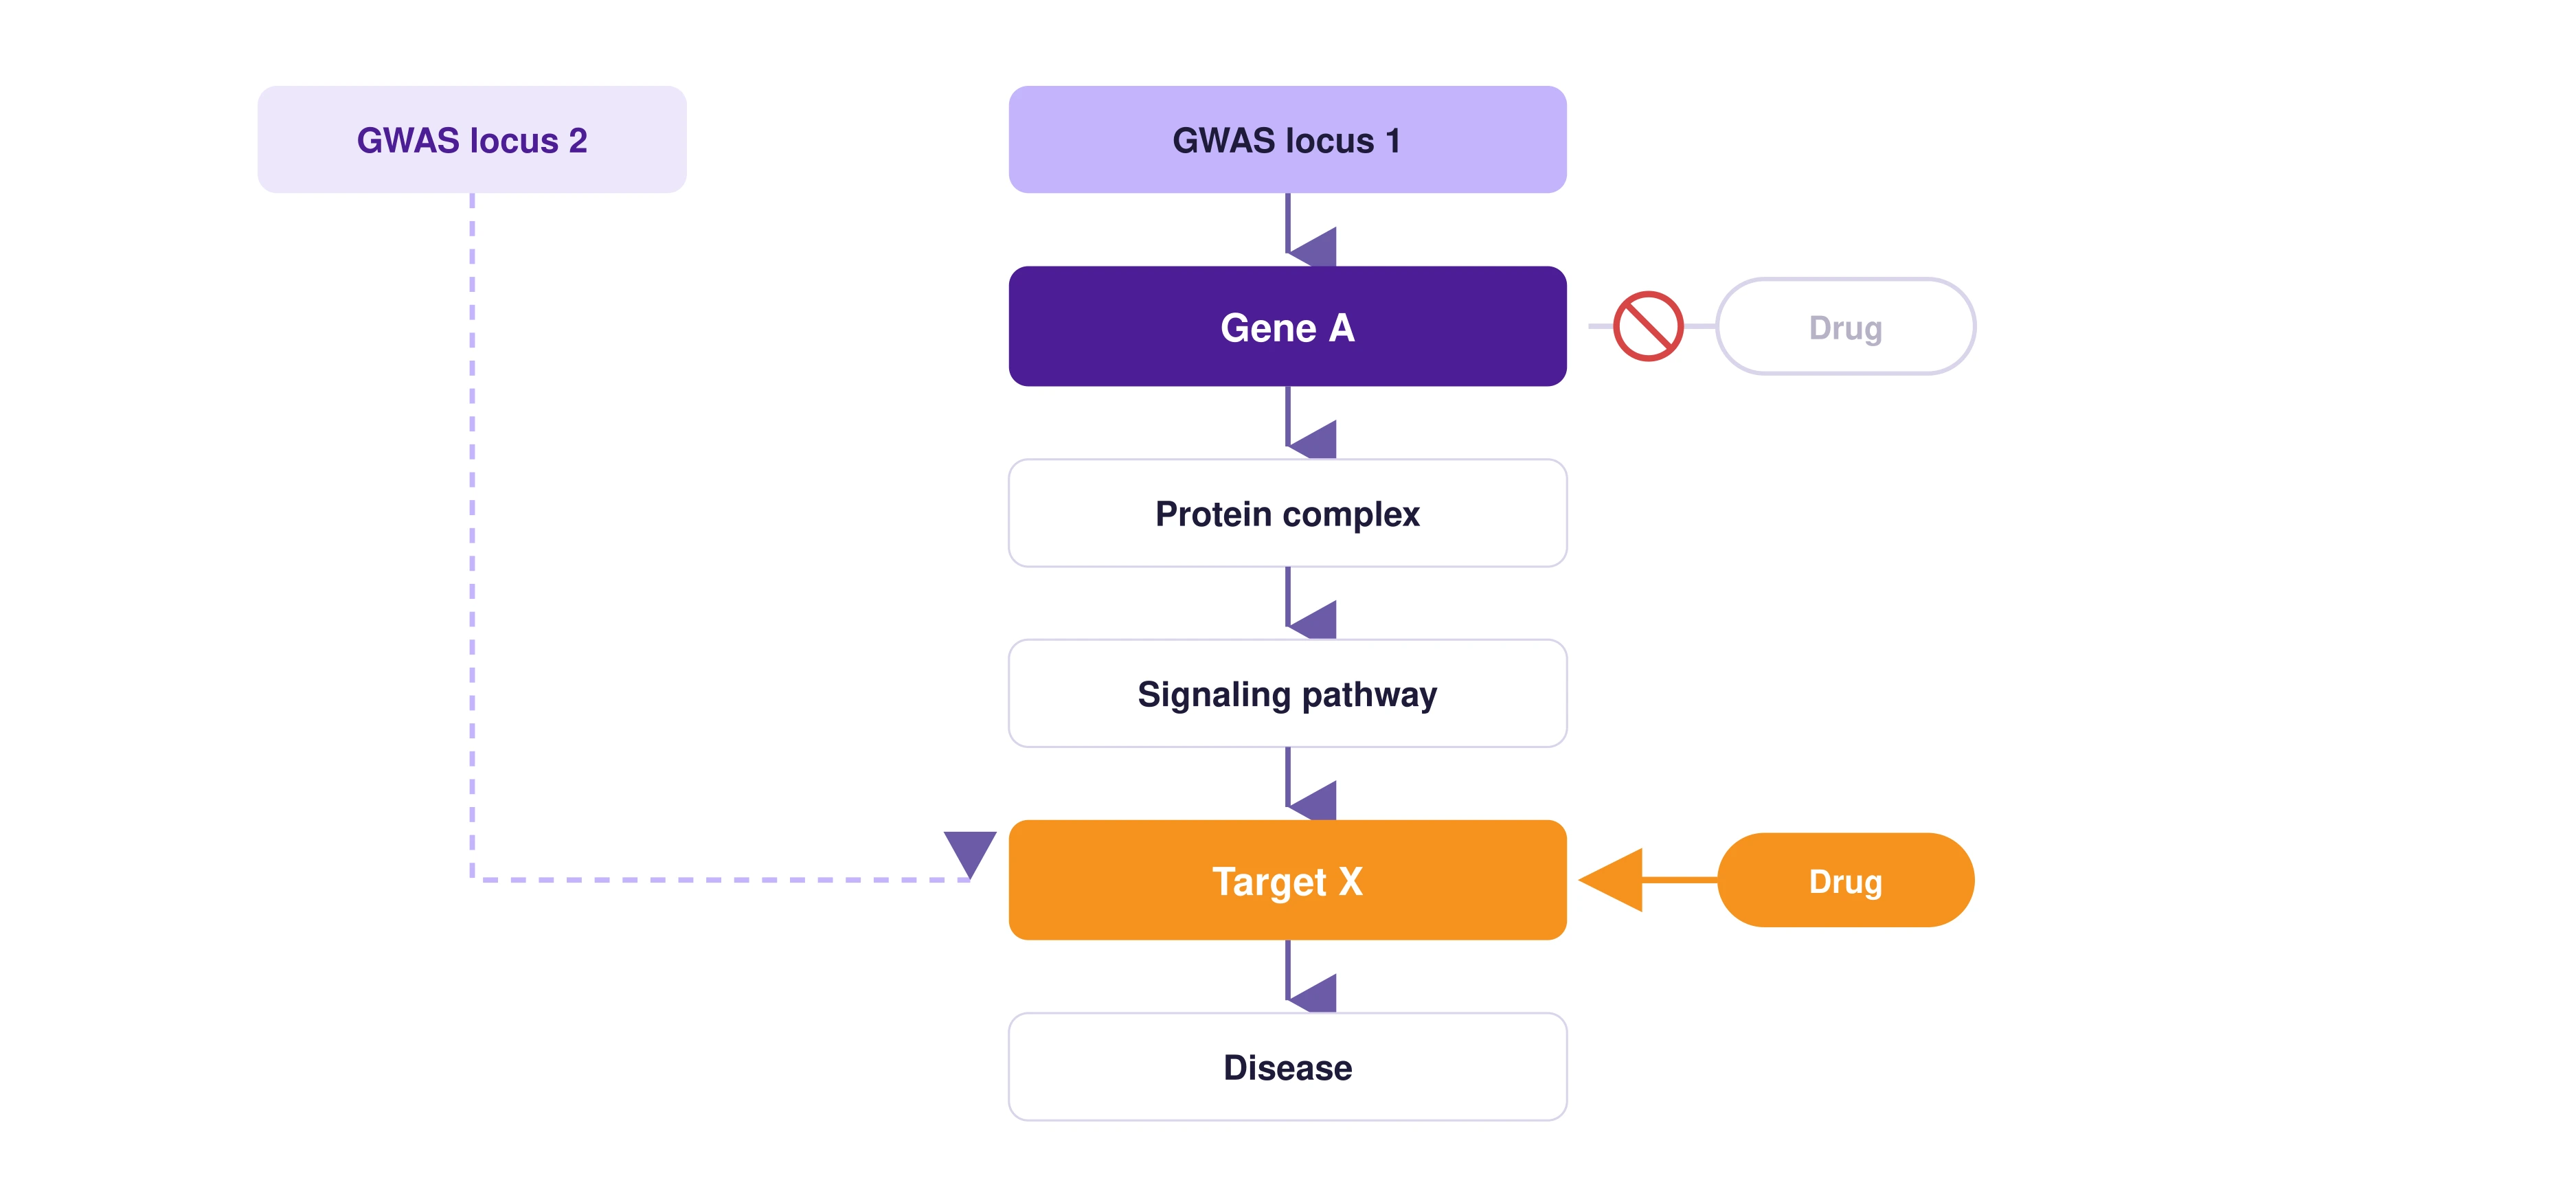
The gene the genetics points to is often not the gene you can drug. The implicated gene may be hard to drug. A more tractable subunit may sit in the same protein complex. An accessible receptor or enzyme may lie further down the pathway. Or several genetic hits may converge on one druggable node.
Finding that better intervention point means following the chain several steps: from the gene to its protein, from the protein to its complex, from the complex to a pathway, and from the pathway to something a drug can reach.
Multi-hop reasoning allows teams to explore targets that may have weak or no direct genetic association but sit on a mechanistically supported path downstream of strong disease biology. It can also connect evidence that would remain separate in a conventional target table.
Published work shows why this matters. In a hyperlipidemia study, following the pathways around the genetic hits recovered PCSK9 and MTTP, two validated drug targets that the list of top genetic hits had missed (link).
How Elucidata's Polly KG does this - Co-essentiality mapping and graph neural network link prediction run directly on its typed edges, so a query can walk from a genetic hit through a protein complex to a druggable node that a direct association list would never surface. Polly KG runs multi-hop queries across genes, proteins, pathways, cohorts, and imaging data in a single operation. Predicted edges are flagged distinctly from cited ones, and a custom scoring framework, built together with a program's own scientists, ranks what that traversal turns up.
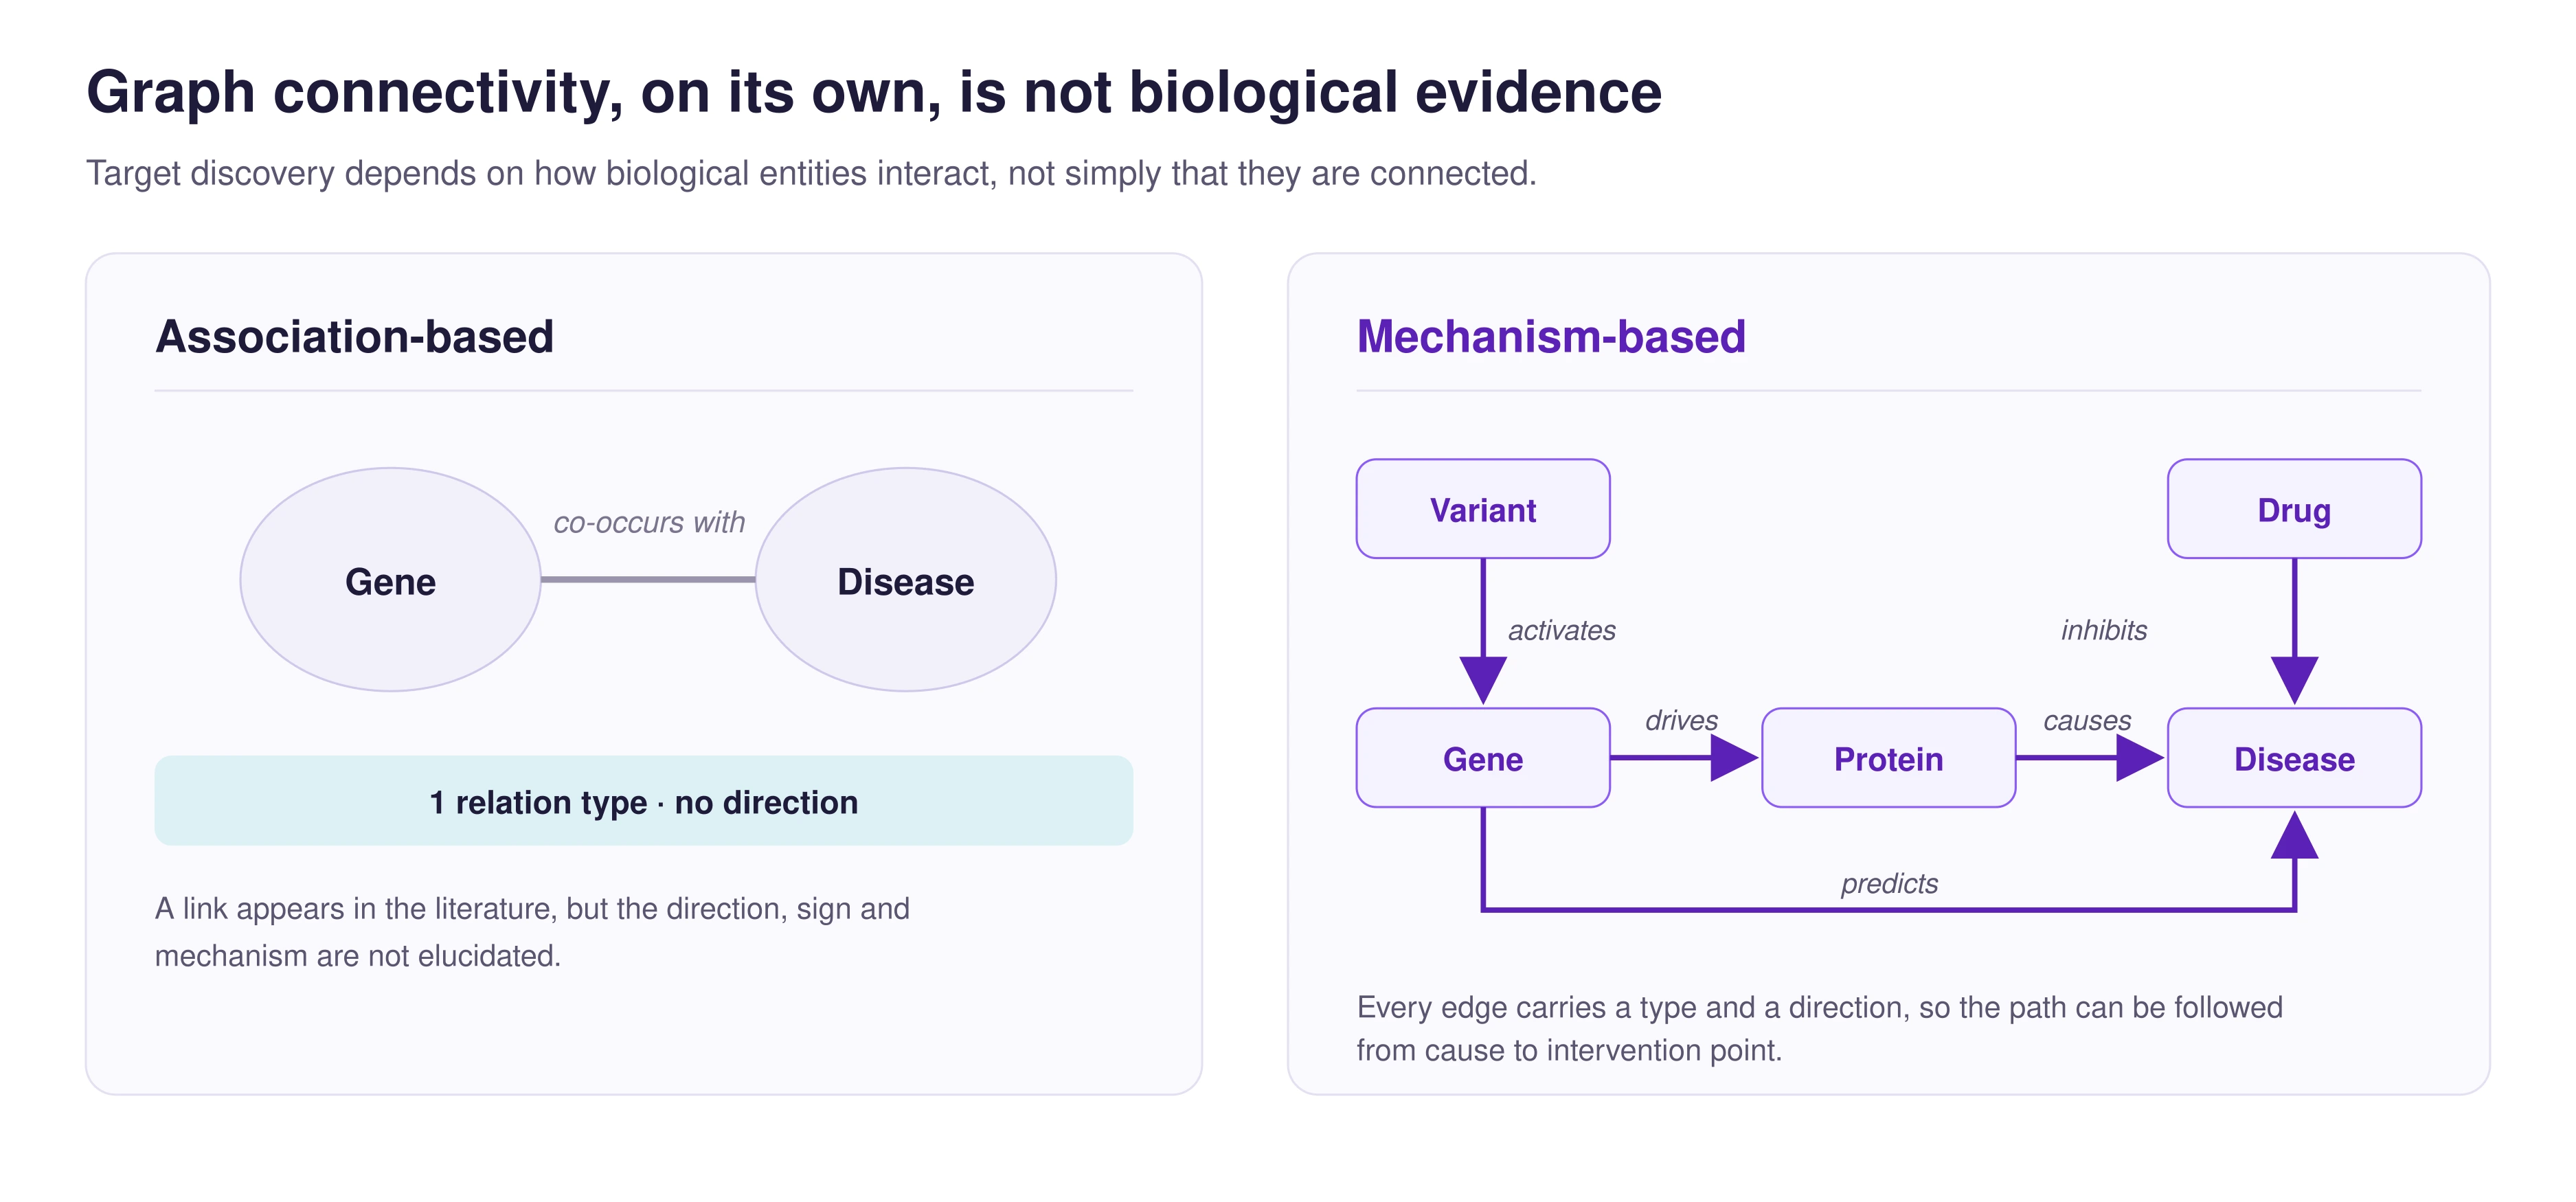
Most knowledge graphs can tell you that a gene and a disease are linked. Very few tell you what kind of link it is, and that difference decides which genes a team actually works on.
Open Targets, the most widely used evidence source in the field, answers all three with the same two words: "associated with." It gives one score, with no relationship type, no direction, and no mechanism [7].
When every link looks the same, the only way left to rank genes is by how much evidence they have, and evidence tracks how much a gene has been studied. In AML, that puts a stem-cell marker like CD34 in the same top 20 as FLT3 and BCL2, which are real drug targets, with nothing in the score to tell them apart [14].
This also explains why the most-studied genes are not always the best targets.
A good edge should therefore say what kind of relationship it is, which way it runs, how certain the finding is, what kind of experiment it came from, and exactly which sentence or dataset it was taken from.
How Elucidata's Polly KG does this - Every claim Polly KG extracts carries one of 19 relationship types, such as "drives disease progression," "therapeutic target for," or "confers drug resistance." Each claim also records its direction, its certainty, the numbers behind it when the paper reports them, and a link back to the exact source sentence [14].
No two programs ask the same question. Tissue matters enormously for one target and hardly at all for another. A graph that arrives already scored has made those judgments for you, before it knew what you were working on.
The bigger issue is whether the graph can take your data at all. Many commercial graphs are closed. They cannot ingest a company's own experiments, or the real-world data it has licensed from vendors, so their coverage stops exactly where the company's advantage begins [8].
A good graph works in layers. A base layer of public biology is usable from the first day. A disease layer adds the datasets that matter for the specific indication. A proprietary layer adds the company's own data and its own scoring rules, agreed with its scientists.
Polly KG - Proprietary and licensed data can be integrated with the public graph through program-specific data models, with prioritization criteria and scoring frameworks defined together with the scientific team.
No two discovery programs prioritize evidence in exactly the same way.
A CNS program may care deeply about tissue expression and blood-brain barrier properties. An oncology program may place more weight on dependency, tumor specificity, and genetic context. A target class may require a different tractability framework altogether.
A useful knowledge graph therefore cannot stop at a fixed public-data layer. It should support three levels:
Customization should apply not only to the data that enters the graph, but also to how evidence is weighted when targets are ranked.
How Elucidata's Polly KG does this - The base graph is queryable on day one, and schema changes and proprietary data are fully delivered within one quarter. In a typical deployment, about half of the graph by weight comes from the customer's own data, which makes each graph unique to the team using it. Scoring is built with the program's scientists. Proprietary and licensed data can be integrated with the public graph through program-specific data models, with prioritization criteria and scoring frameworks defined together with the scientific team.
A graph that only a specialist can query is a graph only a specialist will use. Most knowledge graphs expect the user to know the schema and write a formal query in a language like Cypher. That shuts out most of the people who need the answers [6].
Different people need different ways in. A computational biologist wants code access to build reproducible pipelines. A bench scientist wants to ask a question in plain English and see the reasoning behind the answer. A program lead wants a ranked view of targets. An IT team wants the graph connected to the tools the company already runs.
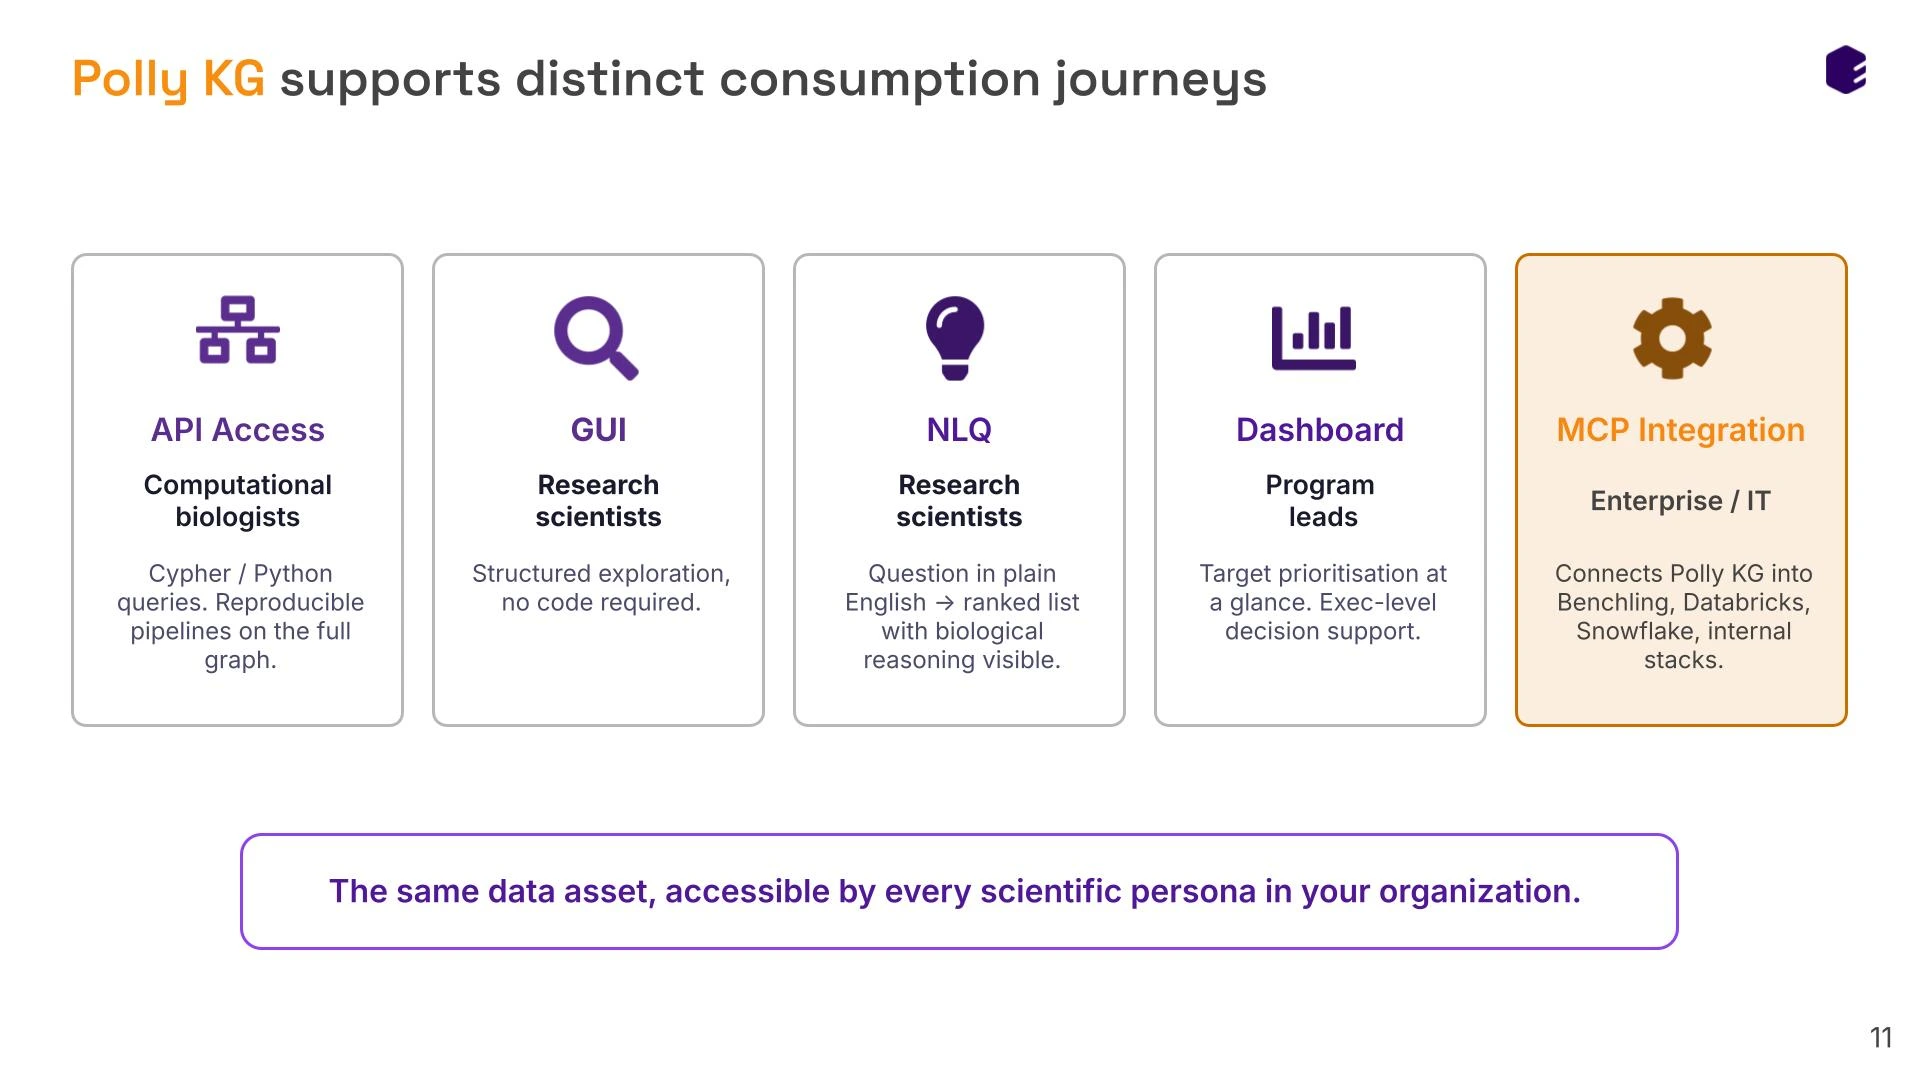
Plain-language access through an AI assistant is the newest of these routes. It changes how easy it is to ask a question, not what the graph knows. The answer is still only as good as the evidence underneath, and it still needs a scientist to judge it [6].
How Elucidata's Polly KG does this - Every route reads the same graph: API and Python access, a graphical interface, Co-Scientist for plain-language questions, dashboards for program leads, and Polly MCP for AI assistants and internal data platforms. The answer is the same however the question is asked. Across deployments, teams average more than a million API calls and over 100 Co-Scientist queries a month [14]
Target selection sets the cost of everything that follows. Only about 1 in 50 discovery programs reaches the market [1], and roughly half of late-stage failures come down to a target that did not work as expected. Targets backed by human genetic evidence are approved at about 2 to 2.6 times the rate of those without it [3].
That is why a knowledge graph adds the most at the prioritization stage. The candidate list is still long, and changing course costs a query rather than a program. Once a target is committed, a graph can only help optimize it. It cannot go back and pick a better one.
What separates graphs at this stage is the evidence they are built on. A graph built mainly from literature inherits the literature's bias toward well-studied genes. A graph built on primary data, with literature as a supporting layer, does not [9]. That is part of why big pharmas have all built knowledge graphs specifically to triage targets at discovery [7].
Elucidata's Polly KG is built on that data-first approach. Across deployments it generates more than 1,000 gene-disease link predictions a month, and teams use it to narrow roughly 20,000 genes to a short list of candidates, each backed by a full evidence package.
Its base layer is ready from day 1: roughly 12.44 million nodes across 13 node types and 40.39 million edges across 183 typed, directional edge types, drawn from 20 or more versioned public sources and 8 million or more full-text papers, distinguishing 18 disease-to-gene relations. Custom scoring applies disease-specific weights developed jointly with a program's own scientists, and edge prediction infers previously unobserved connections, flagged distinctly from directly cited ones [6] [8]. In practice that supports a pipeline from a disease question to a defensible shortlist: discovery over a curated corpus, extraction onto a common schema, graph-based exploration from roughly 20,000 genes to about 20 putative targets, and a structured, cited evidence package per target [6].
MYCN, the master regulator of the disease transition, has no druggable pocket, and standard filtering against public sources left exactly one candidate, already served by an approved drug. Mapping the network around MYCN instead surfaced a previously unreported crosstalk between LCOR and EHMT2, the only member of that cluster with active pre-clinical chemistry.
Given only a disease name, a natural-language session reconstructed the full differentiation-arrest mechanism in NPM1-mutant AML, converging on revumenib, an approved menin inhibitor. Six independently typed evidence layers pointed to the same axis, in under half an hour.
A biotech studying disease-resistant, non-model organisms integrated its own comparative genomics into a graph spanning more than 50 species. Six months later: five high-confidence targets and licensing discussions underway.
Tell us the indication and the evidence you already hold. We will walk through how a purpose-built knowledge graph would be assembled around it, what the base layer answers on day 1, and where your proprietary data would change the ranking. Book a demo
What is a biomedical knowledge graph?
A structured representation of biology in which genes, proteins, diseases, drugs, pathways, variants, phenotypes, tissues and protein complexes are nodes, and the evidence-backed relationships between them are edges. Teams use it to reconstruct disease mechanisms, find non-obvious intervention points, assess tractability, and explore repurposing opportunities.
How does a biomedical knowledge graph help with target prioritization?
It integrates evidence streams that are otherwise read one at a time, and lets a candidate be assessed along multi-step mechanistic paths rather than by direct association alone. Since better evidence at selection is the one lever with a replicated effect on approval odds, the graph is most valuable at prioritization, where the candidate space is widest and the cost of changing course is a query rather than a program.
What is the difference between a literature-based and a data-centric knowledge graph?
A literature-based graph is built primarily on associations reported in published text, which reflect author interpretation and are often untraceable to the underlying measurement. A data-centric graph is built on harmonized primary experimental data, with literature layered on as supporting context, so every edge traces back to a measurement that can be inspected.
Why is co-occurrence a problem in a knowledge graph?
Because a sentence reporting a strong association and a sentence reporting no evidence of association name the same two entities, and a co-occurrence score cannot read the claim, only detect that the names appeared together. Direction, sign and mechanism are all lost, and those are the properties a prioritization decision turns on.
Do knowledge graphs reinforce bias toward well-studied genes?
A literature-first graph does, because mined edges accumulate on genes that are already well published, and research concentrates on roughly 2,000 of about 19,000 protein-coding genes. Bias is a design choice rather than a fixed property: node-degree bias can be tuned deliberately, and a graph grounded in primary experimental evidence can reach the understudied genome.
How should a knowledge graph be made available to scientists?
Through more than one route, because the users differ. Computational biologists want API and query access for reproducible pipelines, research scientists want a graphical interface or plain-language querying, program leads want prioritization dashboards, and IT wants a connector that plugs the graph into existing systems and AI assistants.


.svg)
.svg)


%201%20(1).svg)


%201%20(1).svg)



%20(1).svg)




.svg)
%20(1).svg)


