.svg)
Notable Obesity-related Datasets
Shraddha Dumawat, Deepthi Das
%20(1).svg)
November 10, 2022

Obesity increases the risk of several debilitating and deadly diseases, including diabetes, heart disease, and some cancers. Some pathways are simple and straightforward, such as the mechanical stress of carrying extra pounds. In contrast, others involve complex changes at a molecular level, such as alterations in hormones and metabolism. Using Polly, we can easily explore obesity-related datasets to understand the significance of this disease as a risk factor at the molecular/ pathway level in various other comorbidities.
Dataset ID: SDY473*
Source: Immport
Clinical Trial start date : 2006-08-01
Title: Lovastatin Therapy in Rheumatoid Arthritis (ARA02)
Obesity is an under-recognized risk factor for RA. A link between obesity and RA though plausible has not been explored well. Since biological mechanisms of inflammation are present in adipose tissue, these may be linked to chronic systemic inflammation (see Figure 1). Obesity in RA has been associated with increased mortality risk, cardiovascular comorbidity, total joint replacement, work disability, high medical costs, increased pain, and impaired quality of life.

Because it may secrete adipocytokines, white adipose tissue (WAT) is regarded as a key endocrine organ. WAT is home to numerous immune cell types that interact with adipocytes in obese people. Both rheumatoid arthritis (RA) and osteoarthritis (OA) are risk factors for obesity, and it is believed that some adipocytokines are implicated in the pathogenesis of these two conditions. Leptin levels were connected with insulin resistance in RA, but serum adiponectin levels were associated with radiographic damage and declined as the visceral fat area rose. Leptin levels were linked to higher levels of the biomarkers for bone formation and erosive disease in OA, and a favorable correlation with body mass index was also seen. The increased cardiovascular risk associated with RA and OA may be caused by these adipocytokines.
Statins are a class of prescription medicines used for decades to lower low-density lipoprotein (LDL-C or "bad") cholesterol in the blood. Medicines in the statin class include atorvastatin, fluvastatin, lovastatin, pitavastatin, pravastatin, rosuvastatin, and simvastatin.

The primary objective of this study was
1) to determine the reduction of C Reactive Protein (CRP) in patients with RA if treated with lovastatin (an HMG -CoA reductase inhibitor) vs. patients receiving a placebo.
2) to demonstrate that the reduction of CRP in patients treated with lovastatin is more significant than in those treated with the placebo.
Table 1 The study design
.png)
We can understand the difference in CRP levels across different time points by using clean, harmonized, and structured metadata.
With Polly, one can easily query for datasets of interest in a particular clinical trial and make cohorts out of them using simple queries.
To understand the levels of CRP at different time points, we can make a cohort of the days, -7, 0 (baseline), and the final day, i.e., 84. Figure 3 is a boxplot generated using Polly python to show the changes in the CRP levels across three different time points.

As we can see in this example, the levels change at different time points. The harmonized and structured data allow us to compile various clinical trials and understand differential levels of CRP. The box plot shows the levels of CRP reduced in the Lovastatin cohort compared to the Placebo cohort.
Dataset ID: GSE152815_GPL18573
Source: GEO
Datatype: Single cell
Year : 2020
Title: Synovial fibroblasts from obese hip osteoarthritis patients exhibit distinct single-cell subsets characterised by pathological inflammatory functions
Raw Data : GSE152815
Inflammation of synovial tissue (synovitis) is a hallmark of osteoarthritis (OA) pathogenesis and is pronounced in obese individuals. This study aimed to perform scRNA-seq analysis of synovial fibroblast from hip OA patients who were either obese or normal-weight to identify specific fibroblast subsets that exhibit disease-associated inflammatory functions. scRNA-seq identified eight OA synovial fibroblast clusters, with distinct differences between obese and normal-weight patients.
Fibroblast clusters in obese OA patients highly expressed gene signatures related to immune cell regulation, fibrosis, and inflammatory signaling, including Chitinase3-like 1 (CHI3L1), CXCL12, osteonectin (SPARC), SMOC2 and Galectin-1 (LGALS1). Pseudotemporal expression dynamics demonstrated a transition in the expression of the transcriptional regulator MYC and Inhibin A in normal-weight clusters and the expression of FOS and CHI3L1 in obese fibroblast clusters. Analysis of fibroblast conditioned media showed that obese OA fibroblasts secreted more significant amounts of CHI3L1, whilst normal-weight fibroblasts secreted greater amounts of Inhibin.
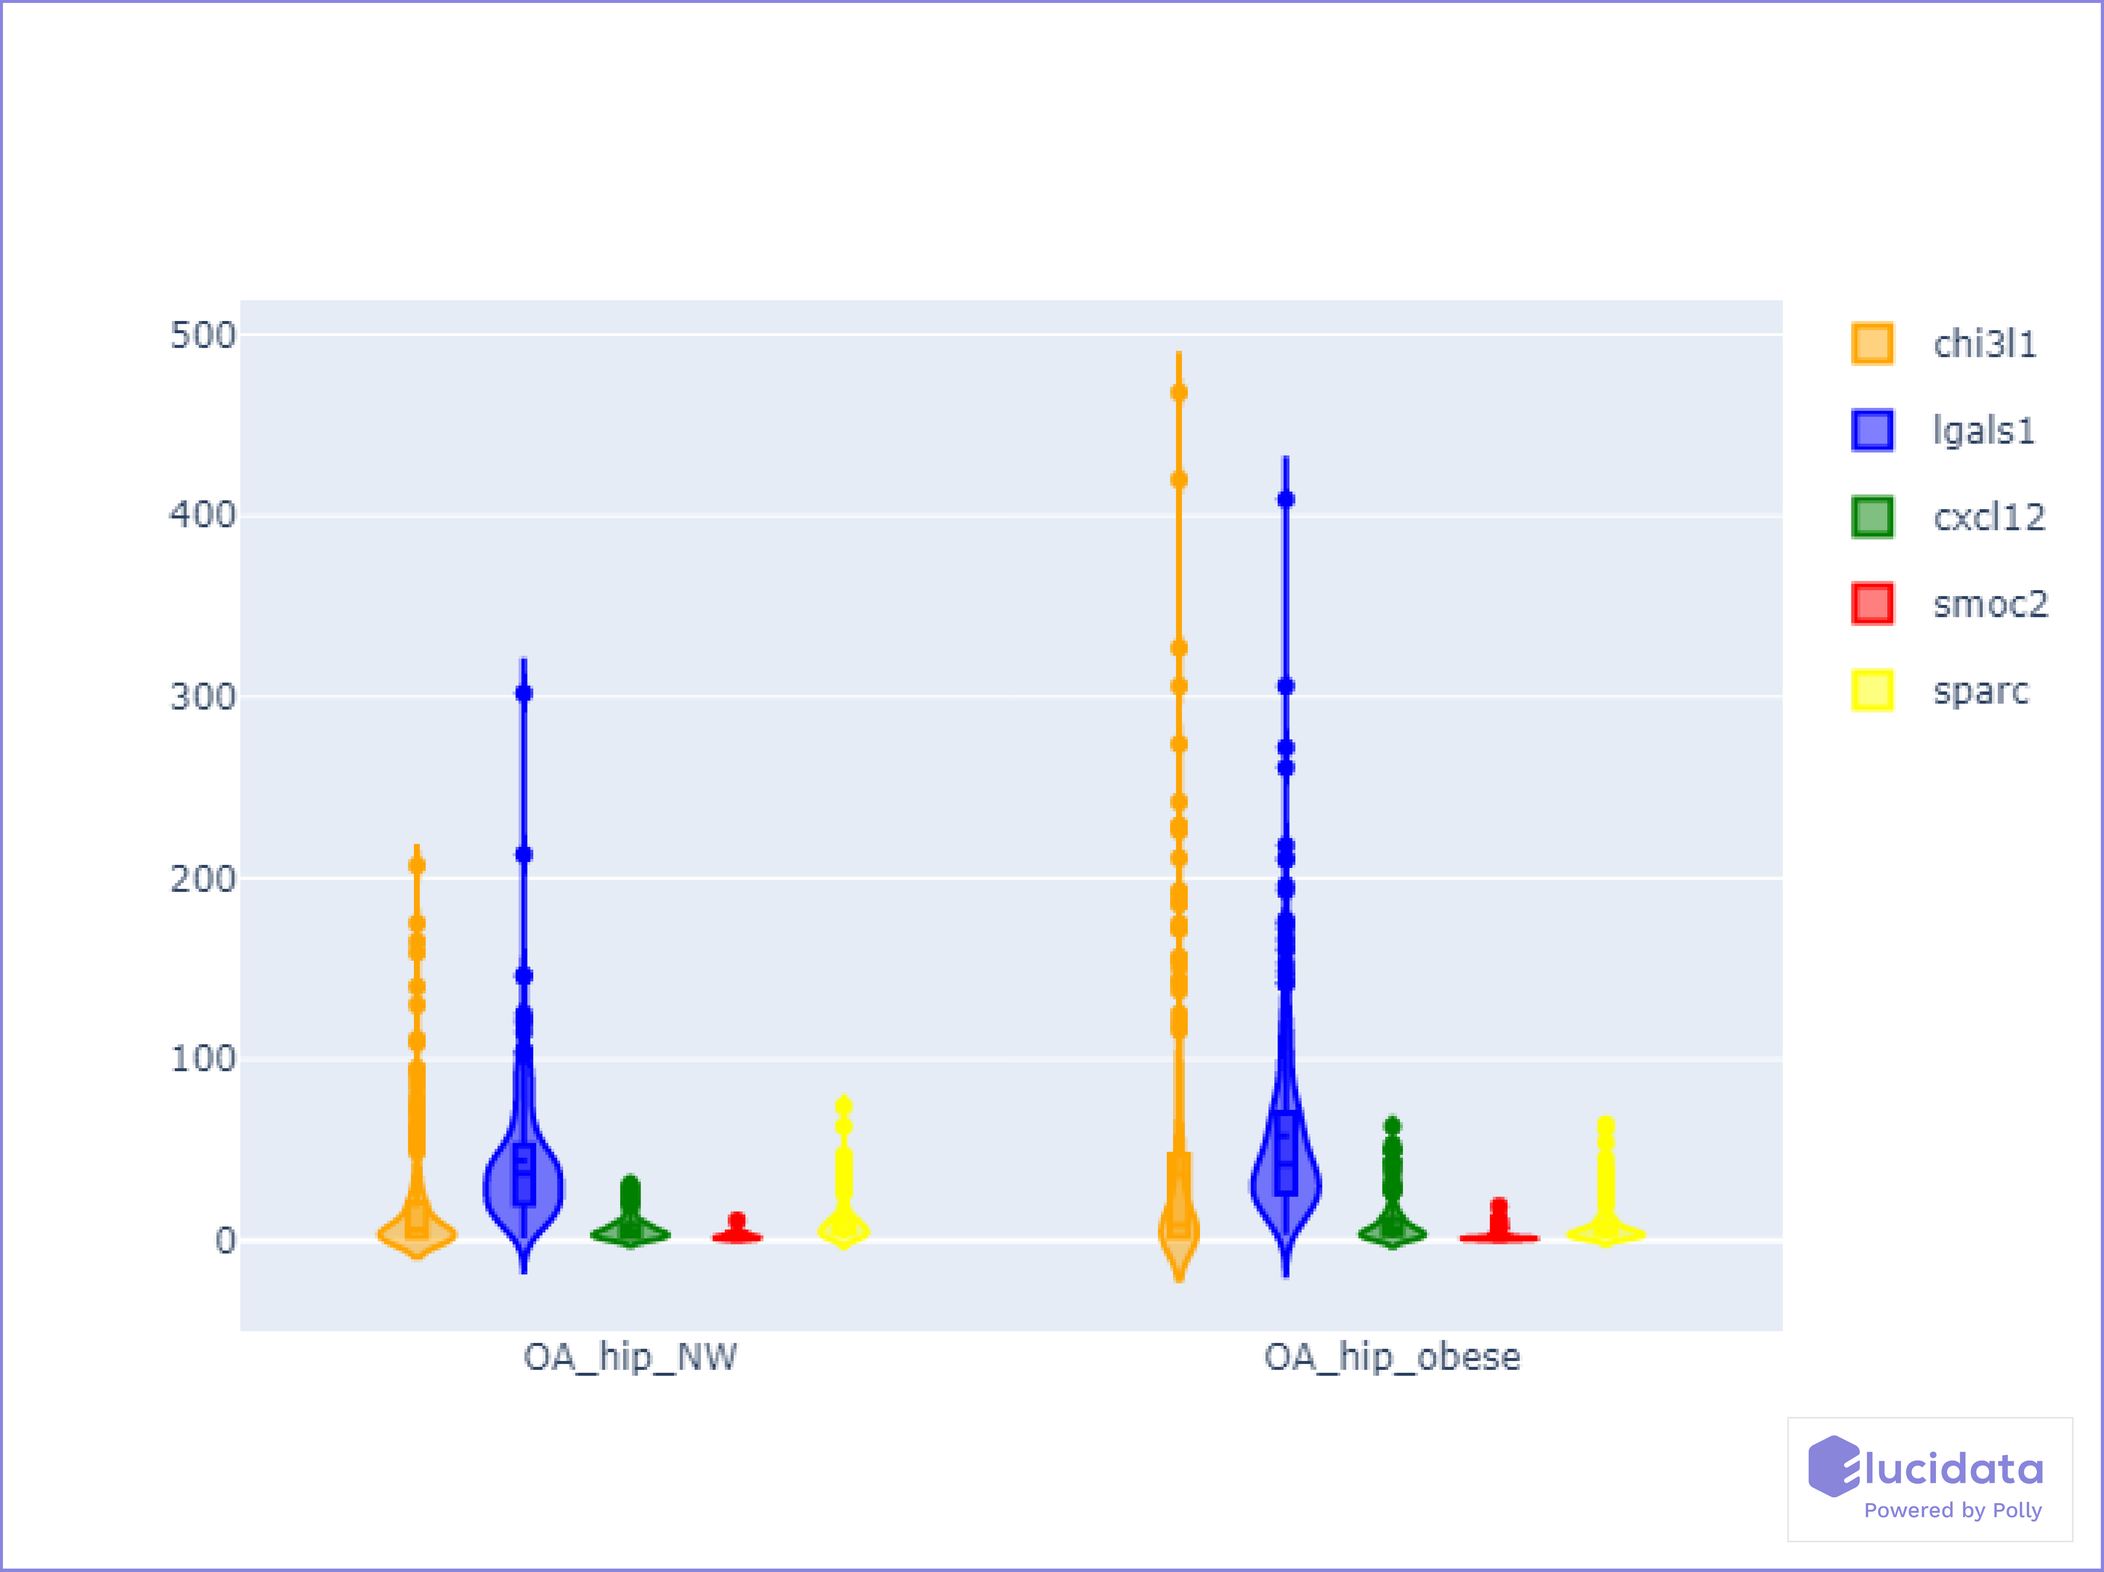
Genes CHI3L1, LGALS1, CXCL12, SMOC2, and SPARC, shown in the violin plot (Figure 4), were highly expressed specifically in the obese cohort of patients, indicating higher susceptibility towards worsening of osteoarthritis.
Cellxgene integrated with Polly python allows one to explore the Uniform Manifold Approximation and Projection (UMAP) for single-cell datasets, comparing it for different clusters or cohorts.

Dataset ID: GSE24185_GPL96
Source: GEO
Data types: Transcriptomics
Year : 2011
Title: A gene transcription signature of obesity in breast cancer
Raw data : GSE24185
Obesity is thought to contribute to worse disease outcomes in breast cancer due to increased levels of adipocyte-secreted endocrine factors, insulin, and insulin-like growth factors (IGFs) that accelerate tumor cell proliferation and impair treatment response. In this study, the authors examined the effects of patient obesity on primary breast tumor gene expression by profiling the transcription of a set of 103 tumors for which the patients’ body mass index (BMI) was ascertained. Sample profiles were stratified according to patients’ obesity phenotype defined as normal (BMI < 25), overweight (BMI 25–29.9), or obese (BMI ≥ 30).
Interested in more datasets? Subscribe to our newsletter here to get monthly updates.
Widespread gene expression alterations in breast tumors from obese patients compared to other tumors led the team to define an obesity-associated cancer transcriptional signature of 662 genes. In multiple public expression datasets of breast cancers (representing > 1,500 patients), a manifestation of the obesity signature patterns correlated with the manifestation of a gene signature for IGF signaling and (to a lesser extent) with lower levels of the estrogen receptor. In one patient cohort, the manifestation of the obesity signature correlated with a shorter time to metastases. Several small molecules either induced or suppressed the obesity-associated transcriptional program in vitro; estrogens alpha-estradiol, levonorgestrel, and hexestrol induced the program, while several anti-parkinsonian agents targeting neurotransmitter receptor pathways repressed the program.
Obesity in breast cancer patients appears to impact the gene expression patterns of the tumor (perhaps as a result of altered body chemistry). These results warrant further investigation of obesity-associated modifiers of breast cancer risk and disease outcome. Figure 6 describes the key role of obesity in breast neoplasm while comparing the cohorts of obese versus normal-weight patients. It indicates the upregulation of cancer-causing pathways based on the obesity of the patient.

Figure 7 represents the KEGG pathway of cancer to understand the significant up-regulation of genes in obese patients, further leading to the worsening of breast neoplasms.

Polly python allows for the analysis of RNA-seq and single-cell data with ease because of its structured and harmonized repositories. Take a look at various notebooks for examples of the consumption of your data here.
Connect with us to accelerate your journey of finding relevant biomedical datasets, creating cohorts, visualizing & analyzing the data, thereby deriving actionable insights and probable targets.

%20copy%201.webp)

.webp)

.svg)
.svg)


%201%20(1).svg)


.svg)
%20(1).svg)


